Project Dashboards
Each project has a dashboard home-page that summarizes all of the information regarding the project into a comprehensive, easily digestible form that provides a “one-stop-shop” for people interested in understanding the overall status of the project at a glance.
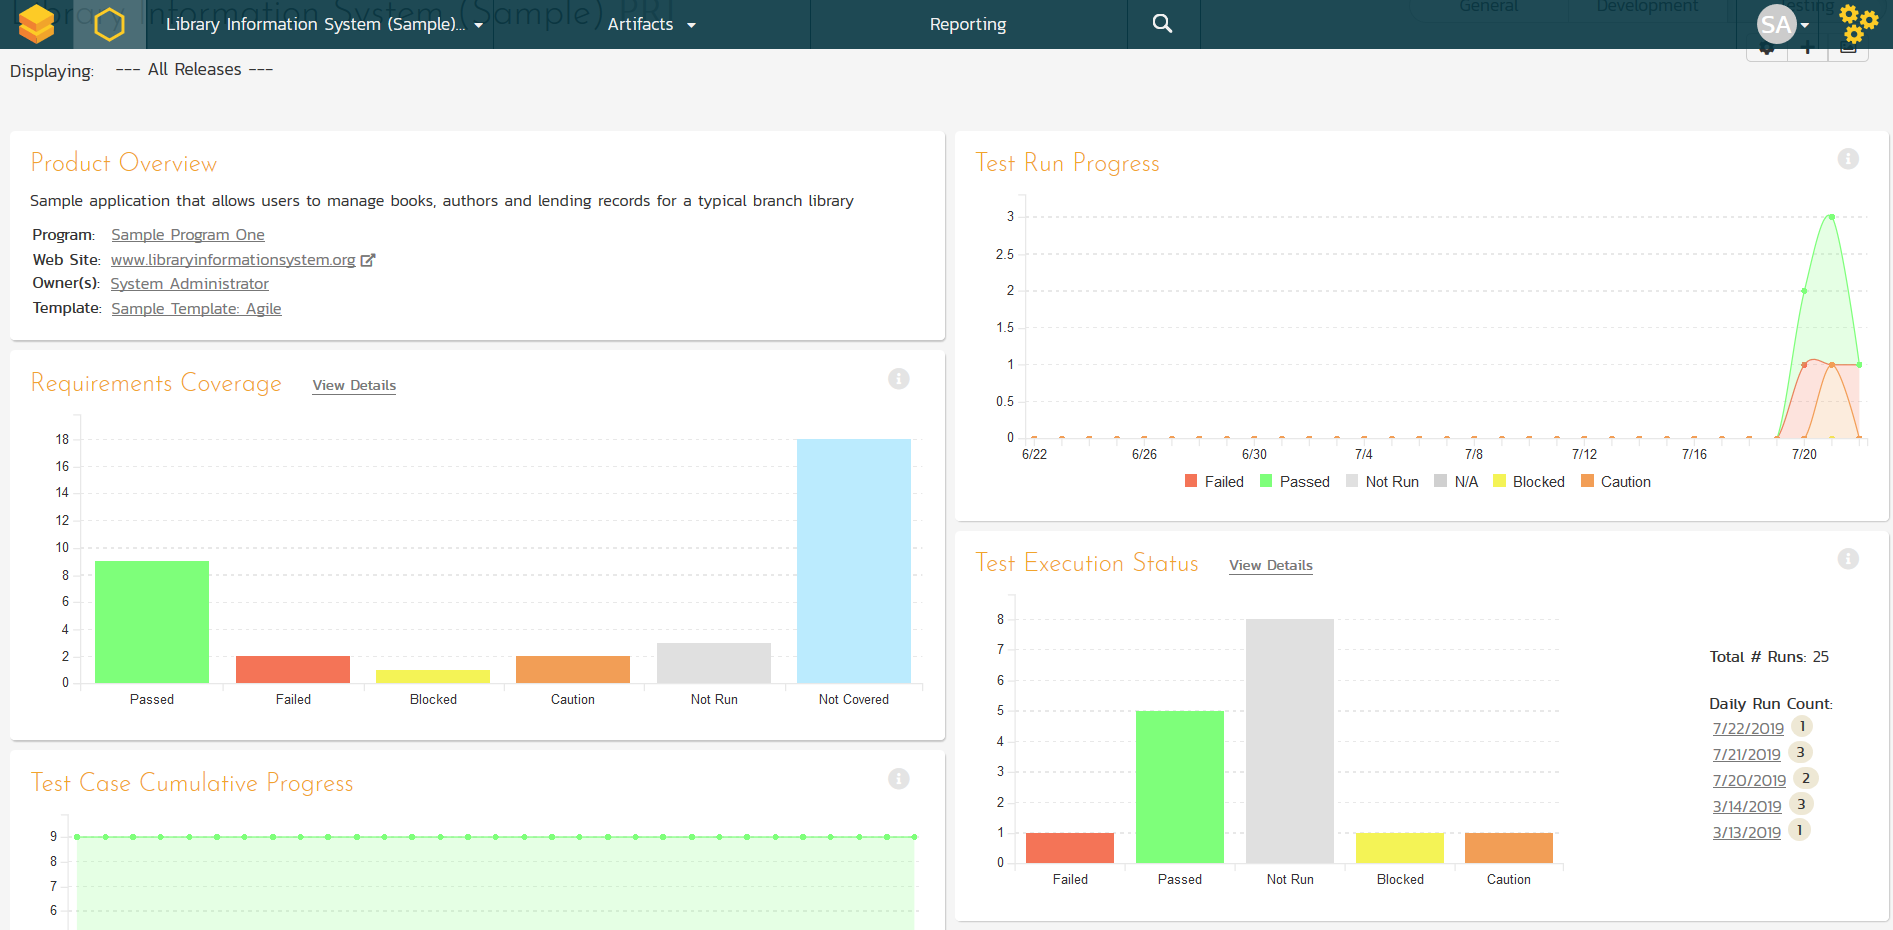
It contains summary-level information for all types of artifact (requirements, test cases, incidents, etc.) that you can use to drill-down into the appropriate section of the application.
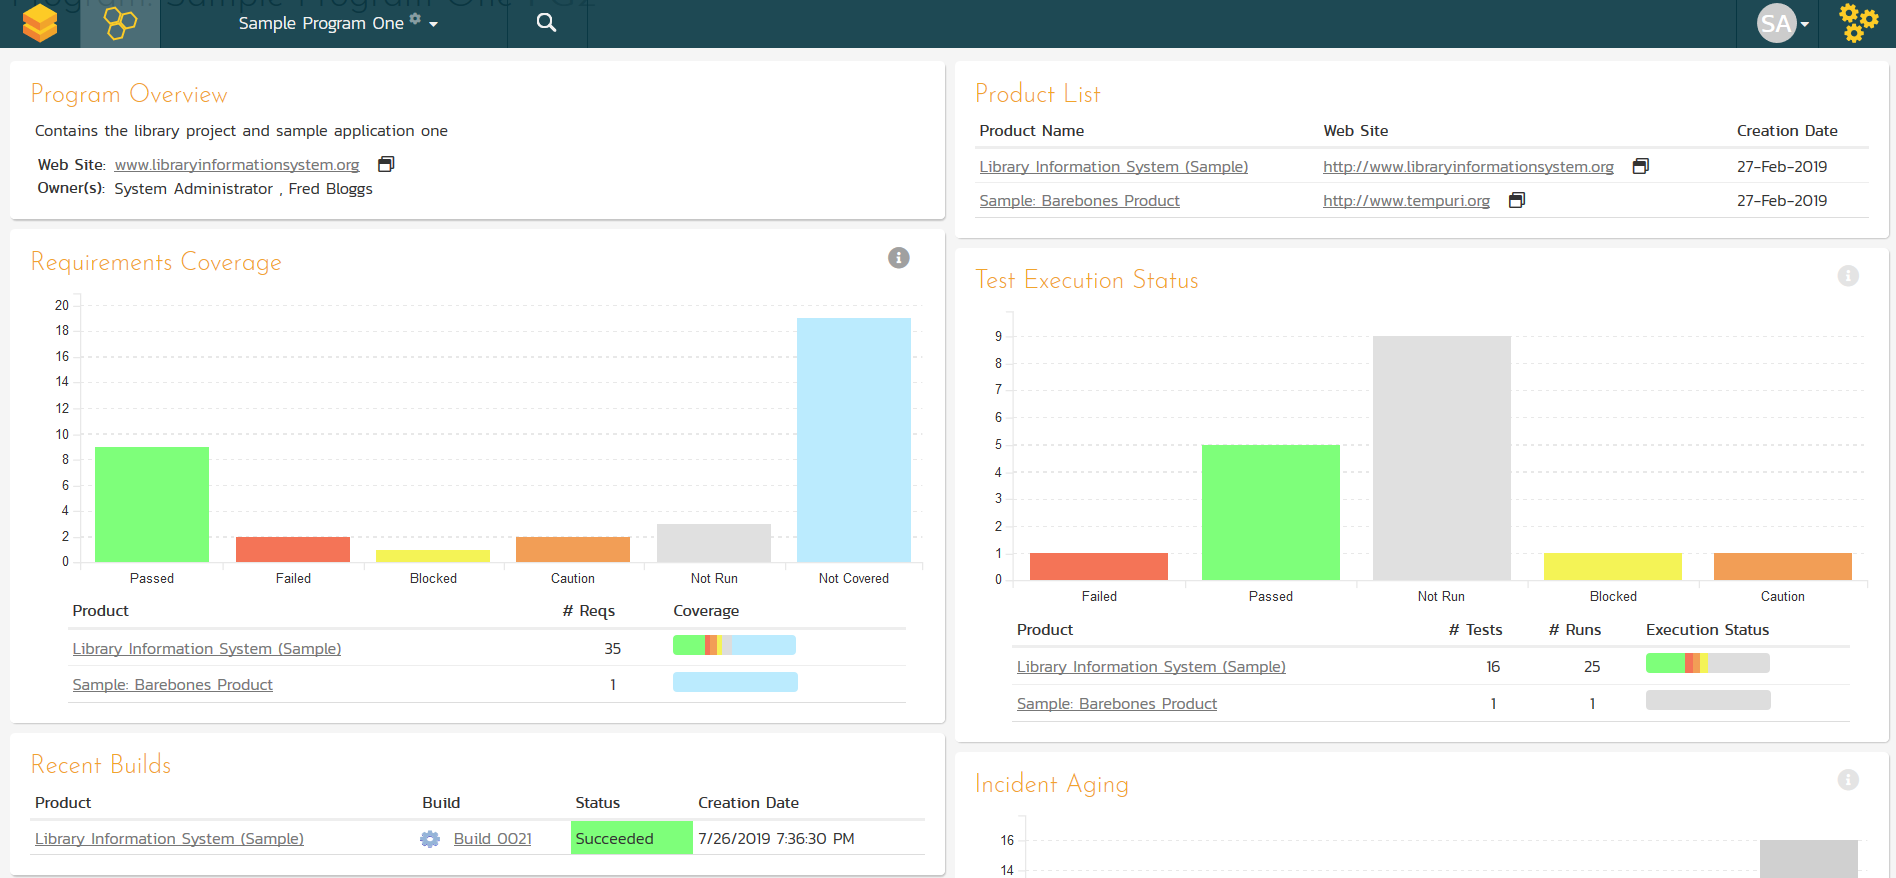
Project Portfolio Dashboards
SpiraTest lets you manage your projects as programs. Each program has its own dedicated dashboard that lets you assess the metrics across the program as well as benchmark each project side by side:
Customizable Reporting Dashboard
SpiraTest includes an extensive reports library that can display information such as Requirements Coverage, Test Case Execution, and Incident Status. SpiraTest allows you to build a customized reporting dashboard featuring your frequently-used graphs, charts and reports.
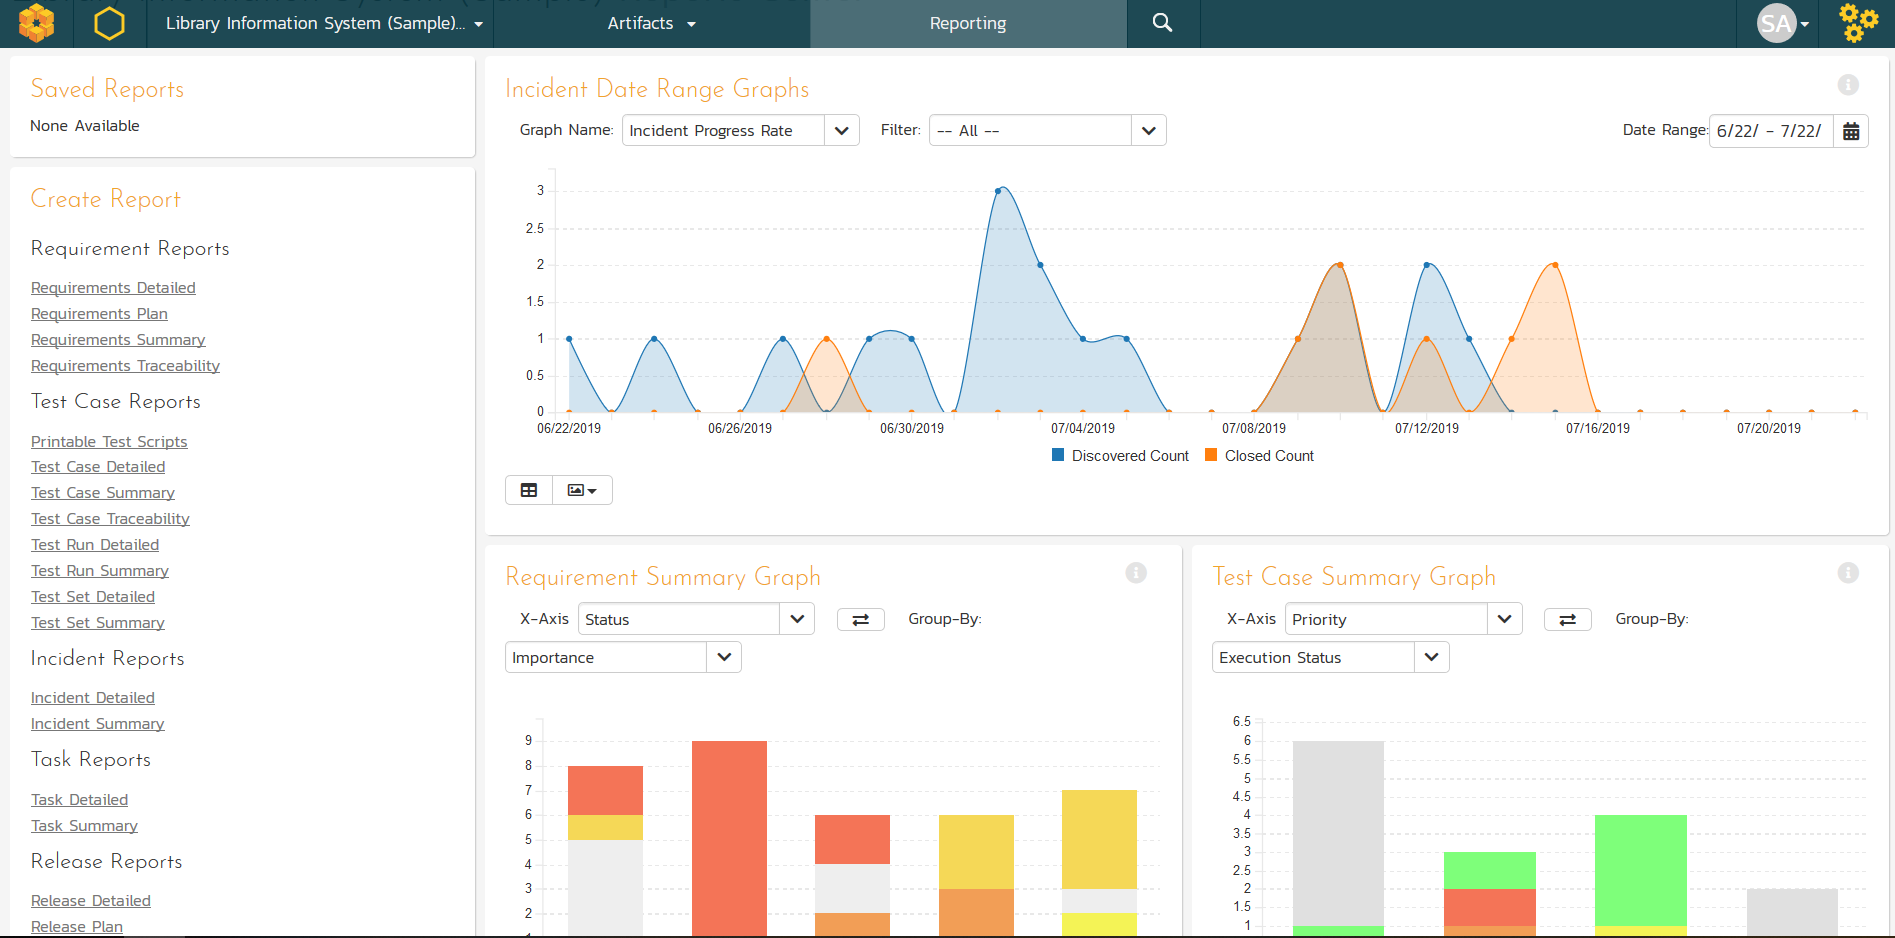
The graphs available include: Requirements Coverage, Test Run Progress, Incident Discovery Rate, Cumulative Artifact Counts, Customizable Summary Graphs, Date-Range Graphs and more.
Custom Graphing Engine
We know that you can never have enough graphs and charts. SpiraTest includes a custom graphing engine that lets you write your own graphs using the full power of SQL. You can then publish these graphs for your team to use.
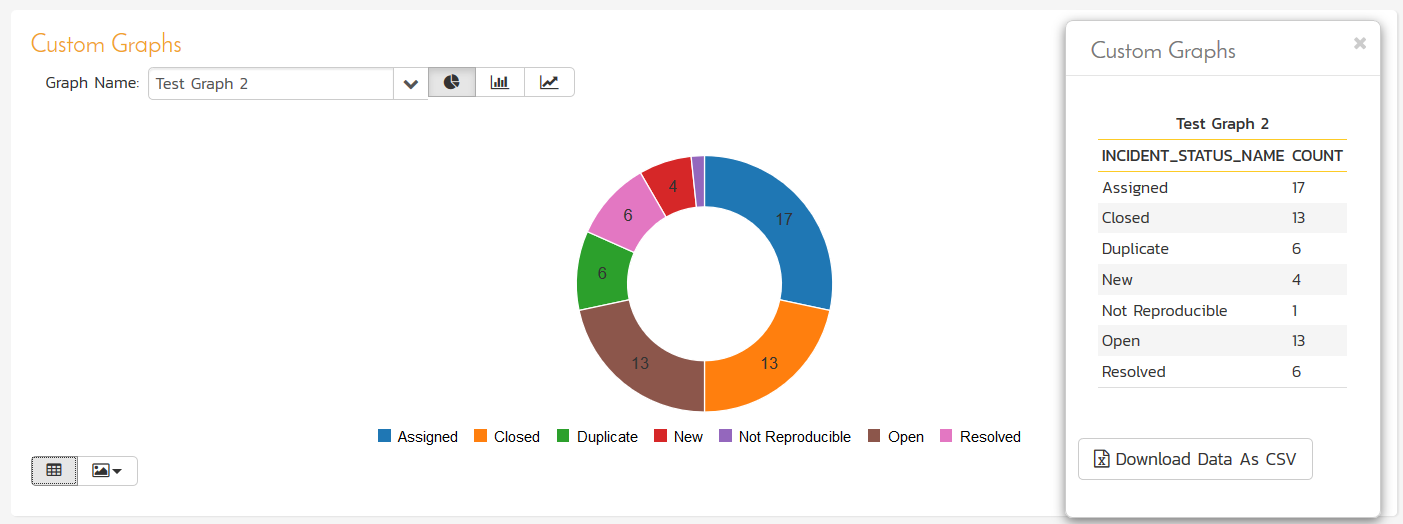
The graphing engine lets you visualize your data in donut, pie, and line chart formats, as well as display the underlying data, and export to Microsoft Excel for further analysis.
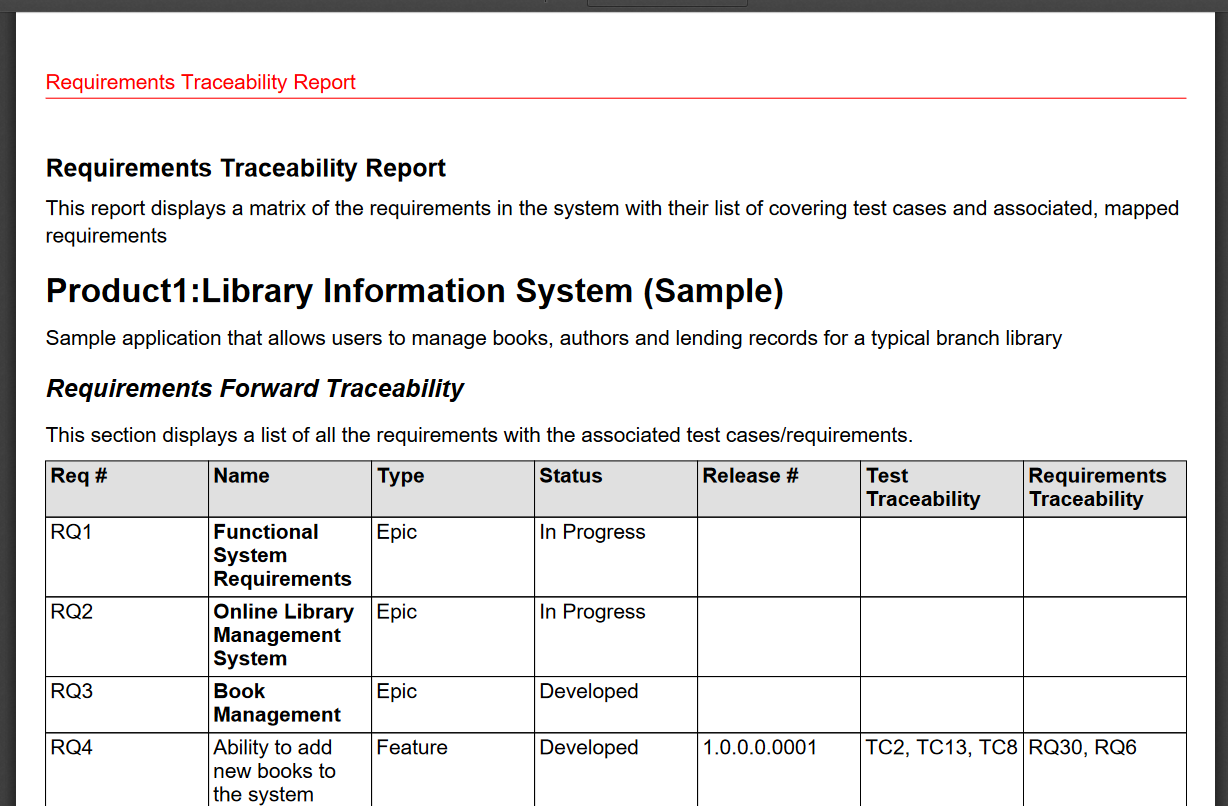
Report Document Generator
SpiraTest can produce printable reports, documents and spreadsheets from the data in the system using the rich library of standard reports. The formats supported include MS-Word, MS-Excel, Adobe Acrobat PDF, HTML and XML.
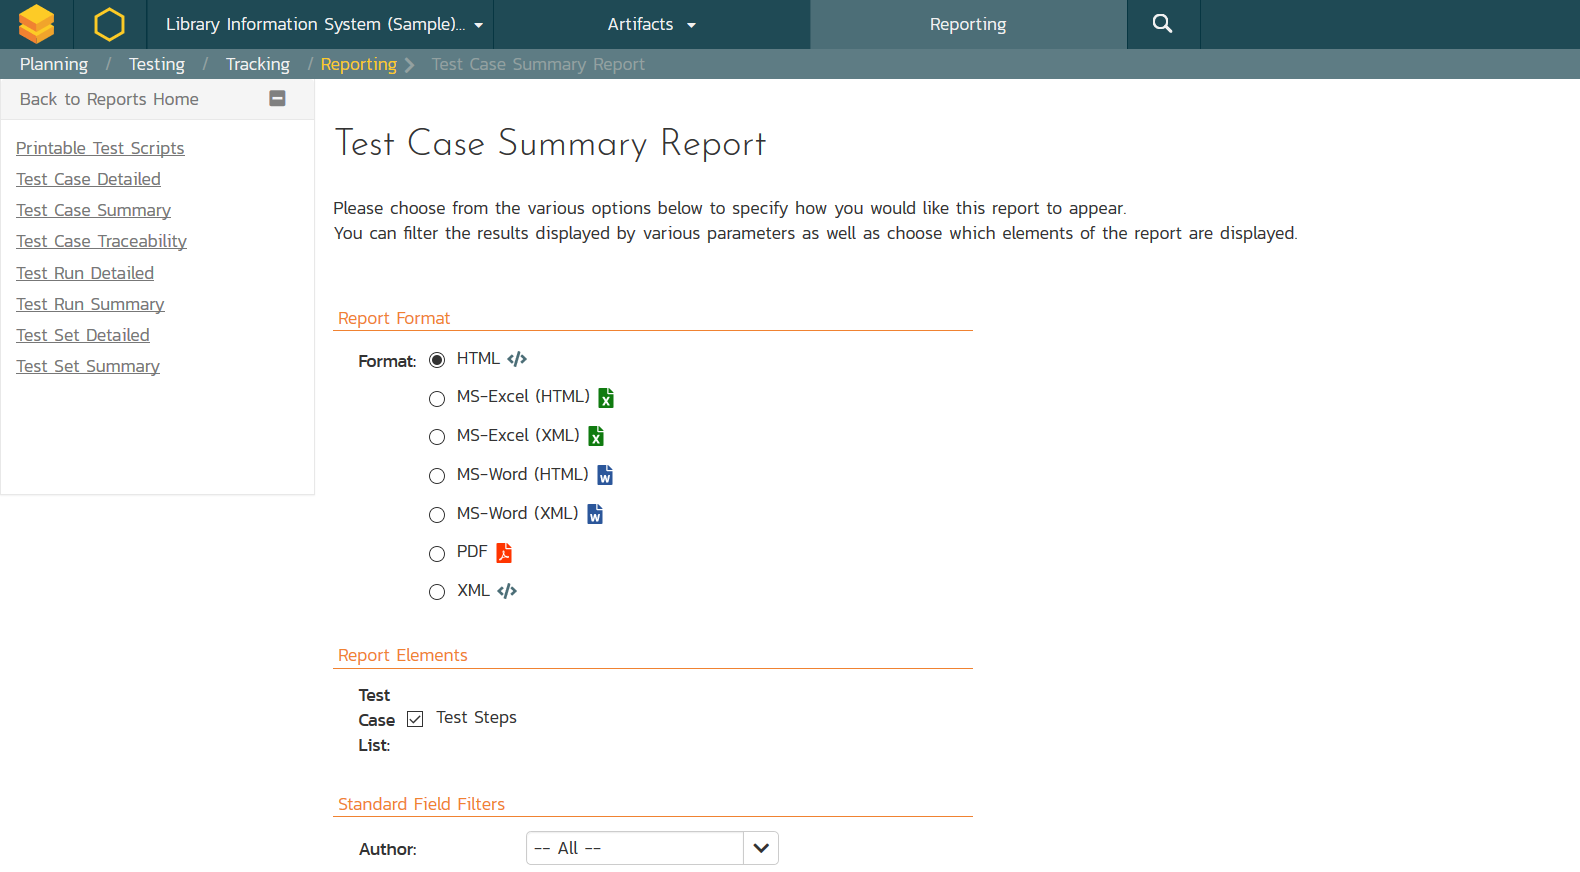
Each report can be configured by users, with the option to include different elements, filter by any of the built-in or custom fields. You can choose to either run the report immediately or save for future use, with an option to share with the whole team.
Custom Report Templates
SpiraTest includes a built-in custom report builder that lets you define report templates that can consist of multiple sections.
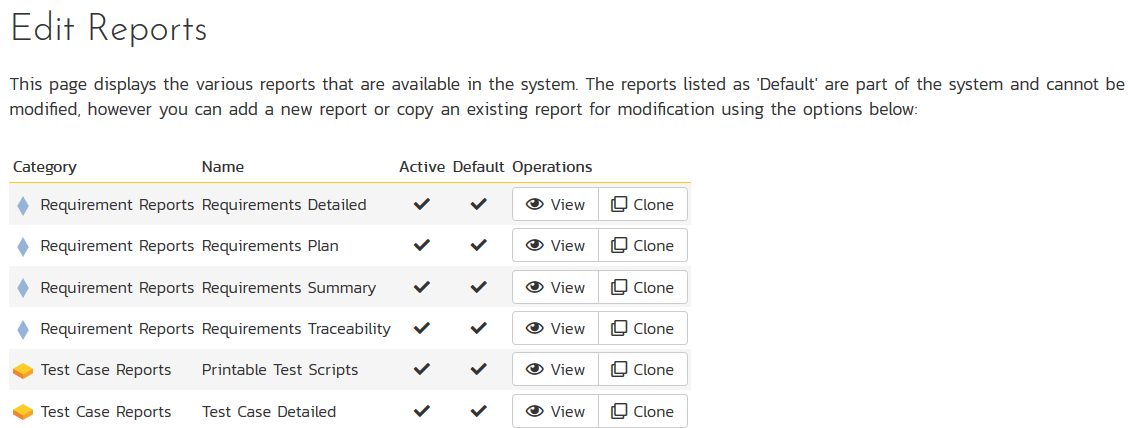
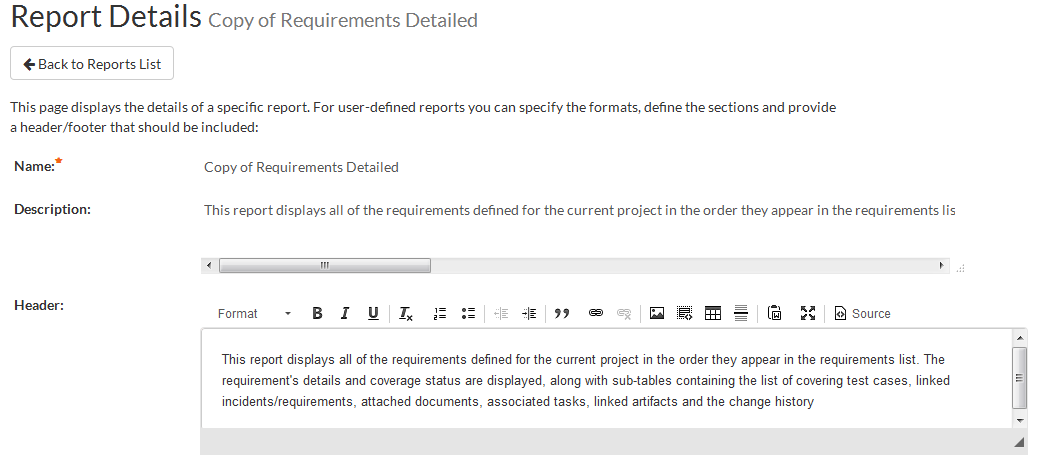
The Rich Text editor allows you to add custom headers and footers to the entire report and to each section, and the report templating engine allows you to define the layout and style of the report using the industry standard XSLT templating language:
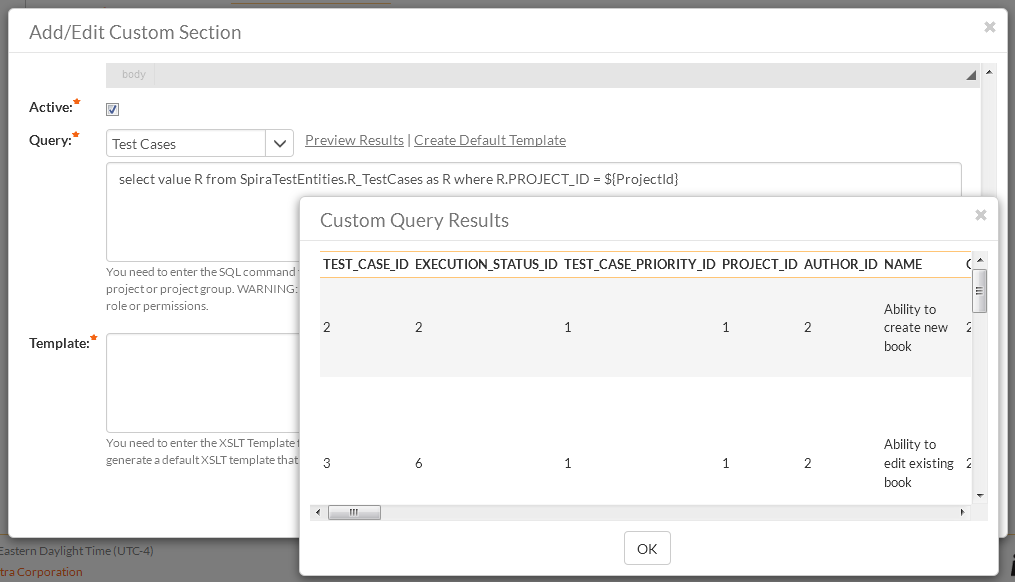
Custom Report Queries
In addition to the customized templates, you can include custom sections in your reports that contain user-defined data queries written using the industry-standard Structured Query Language (SQL). This gives you the ultimate in flexibility in designing reports that meet the needs of your organization:
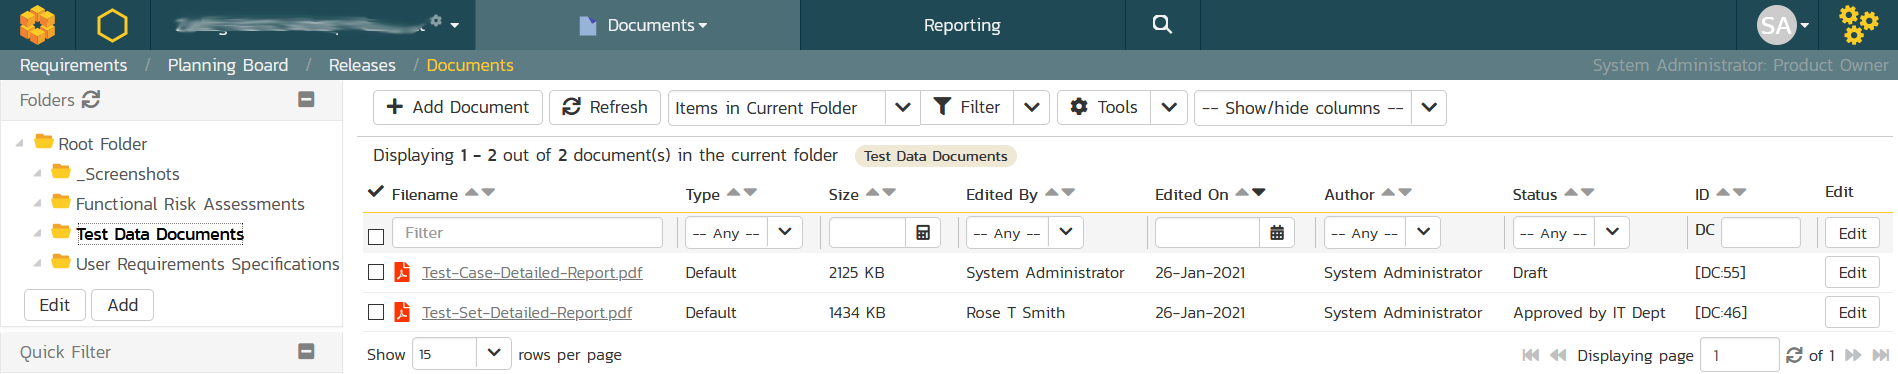
Save Generated Reports as Documents
SpiraTest lets you automatically save generated reports from the Reports center into the Documents Management module, where they can be archived and versioned.
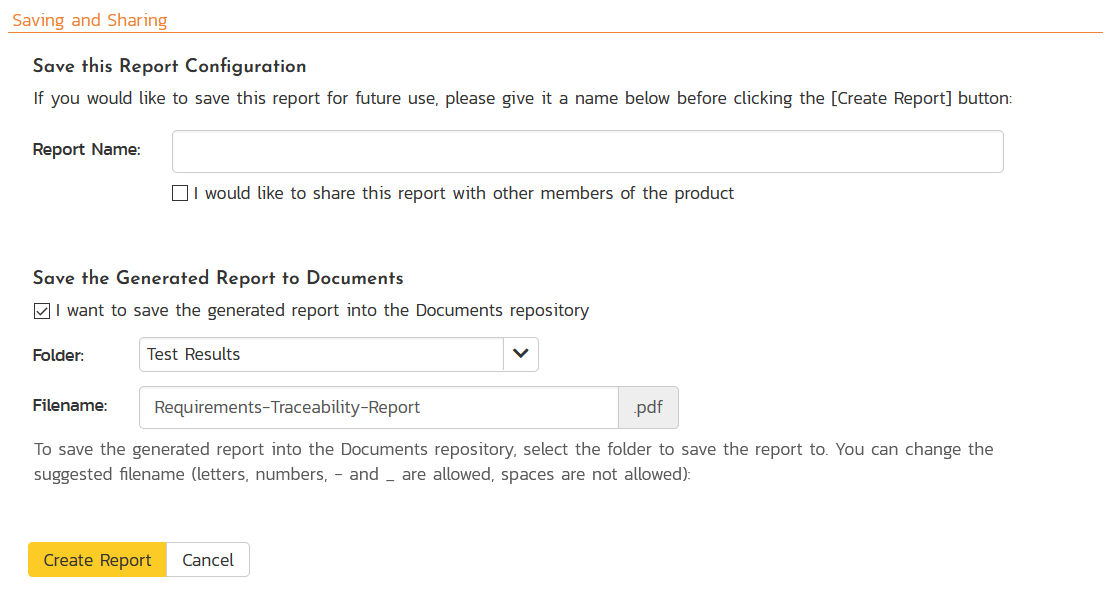
If you came from a traditional document-centric world, where your requirements, test cases, and other project artifacts were actual physical documents, this feature lets you store and manage the results of your testing and validation activities as documents. This lets you assign these documents to reviewers to be approved using the standard SpiraTest document management workflows.
Try SpiraTest free for 30 days, no credit cards, no contracts
Start My Free TrialAnd if you have any questions, please email or call us at +1 (202) 558-6885