July 22nd, 2015 by Adam Sandman
One of the maxims I always tell developers is that regardless of what you build, customers will never be satisfied with the reports you offer or the integration that you provide. In fact the two most underestimated tasks in software development are data feeds and reporting. So one of the nice features in SpiraTeam is the ability to do custom reporting, so that you are not limited to just the reports that ship with the system. This article is the first in a series that explains how to use these powerful custom reporting features.
Getting Started
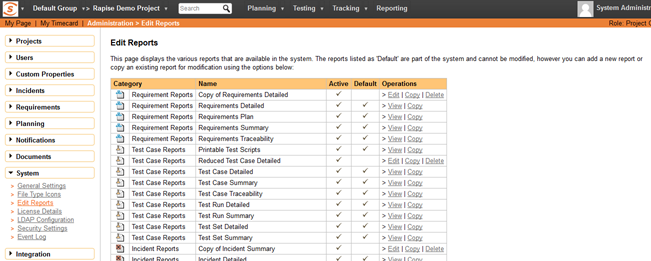
The first thing you'll need to do is login to Spira as a system administrator (or user with the system admin flag enabled). Only system admins can create or modify reports because they have the potential to affect all projects in the system. Once you are in the administration section, click on the 'Edit Reports' hyperlink:

From here you can either make a copy of one of the existing Spira built-in reports or create completely new report from scratch. The decision of which choice to make will depend on whether:
- You want to take one of the existing reports and modify it for your needs (in which case just make a copy of it)
- You want to create a report of your own that is not similar to any of the built in ones (in which case just create a new one).
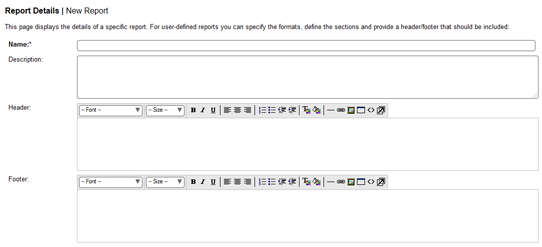
Once you have done this, you will be able to click on the 'Edit' link for the report which will display a list of formats, sections as well as the header and footer of the report.

Custom Reports Terminology
When you edit a report you will see the following different items that can be changed/edited:
- Name - the name of the report is simply how it will be listed in the main Reports section of the application
- Description - this is the description of what the report is for. It will not be displayed in the report itself, but will be displayed as a tooltip in the Reports section of Spira
- Header - This is a rich text box that you can enter formatted text into. This will appear at the top of the report above any of the different content sections. You can embed images and include tables, lists or other stylistic elements
- Footer -This is a rich text box that you can enter formatted text into. This will appear at the bottom of the report after all of the different content sections. You can embed images and include tables, lists or other stylistic elements
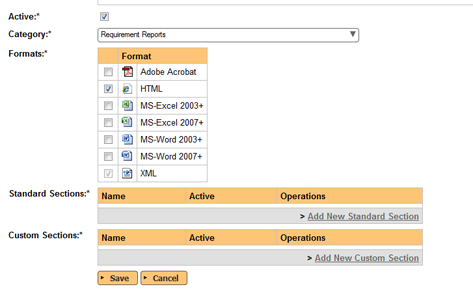
- Active - This simply marks whether this report is ready to be used (active) or not.
- Formats - All of the Spira reports are generated first into HTML and then converted into one of the other formats. This section lets you choose which formats your report will be available in. Note that if your record has a lot of textual data, it may not convert well into a tabular format such as Excel.
- Standard Sections - these are described in more detail below
- Custom Sections - these are described in more detail below

Types of Report Section
There are two types of report section that you can use in your report:
- A standard section basically uses an existing pre-defined query that returns back some structured XML data from Spira. For example the 'Project Overview' section will include the project name, description and other meta-data and the 'Requirements Summary' section will include an XML representation of all the requirements in the project together with any child data nested (e.g. all of tasks that belong to a requirement or the list of comments, etc.). A key aspect of a standard section is that the data itself is not customizable, but you can change the XML Template (XSLT) that is used to extract the data and convert it into a viewable form. So you have the ability to use XSLT to transform the data. You also allow the user who runs the report to use the standard set of filters on the data (e.g. return only requirements in release 1.0 or test cases that are priority 1,2,3)
- On the other hand, a custom section, lets you use a custom database query using the Microsoft Entity SQL (ESQL) language to query the different database view in the system join records, aggregate data to generate a completely custom table of data that you can then transform using an XML template (XSLT) to display it in a specific form (e.g. a table of data, a simple list, etc.). So you have the ability to two two tools: ESQL and XSLT to generate the report. The advantage over the standard section is that you are not limited to the queries that we have already defined in the system, but a custom section does not provide filter options for the end user.
A report you create can have a mixture of the two sections, for example you could start the report with the standard project name and description and follow that with a custom section that displays a table of custom data (e.g. a risk cube or other table of data).
Next Episode
In the next installment of this series we shall be taking one of the standard reports and using the standard section XML editor to make some changes to the XSLT template to hide some columns and add a new calculated column.
