Overview
When web applicationperformance suddenly becomes worse, there may be many potential causes (see Troubleshooting Performance Issues ). Gathering information about the current requests being handled by the worker process can help to identify issues impacting performance.
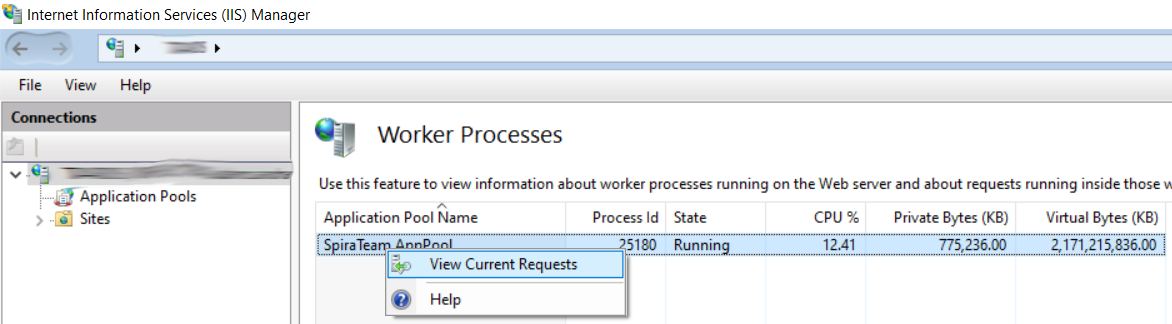
The Internet Information Services (IIS) Manager provides a server-level Worker Processes feature that manages "a list of worker processes running in application pools on a Web server." The information provided includes the Application Pool Name, Process ID, State of the process, CPU percentage, Private Bytes, and Virtual Bytes.
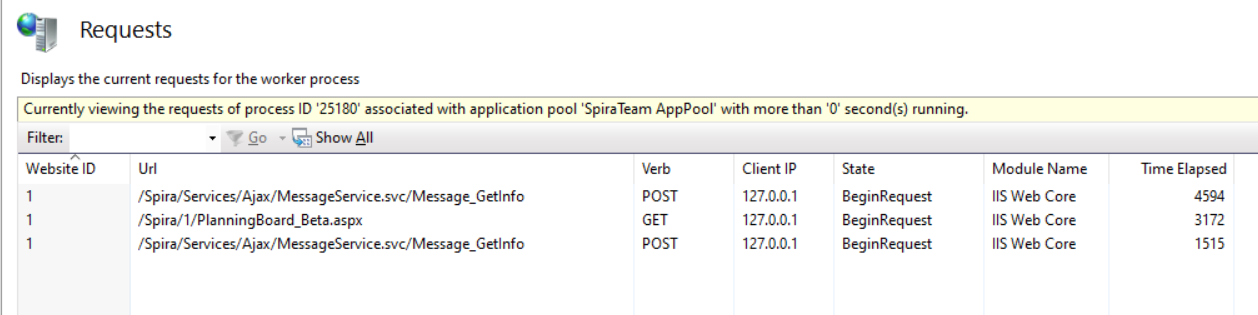
Additionally, if enabled, the View Current Requests action is available. The View Current Requests displays the current running requests in a worker process. Several fields provide data to investigate performance issues; for example, the URL, Client IP, Pipeline Module State and Module Name, and the Time Elapsed for a request.
This KB provides the steps to install and use the IIS View Current Requests action.
Installing the Request Monitor
- To enable the View Current Requests action in the Worker Processes feature, the Request Monitor feature must be enabled. The following steps are typical among later Windows operating systems:
- Open the Server Manager.
- Select Roles and locate the Web Server (IIS) role.
- Click Add Role Services .
- Locate the Health and Diagnostics section then select Request Monitor .

- Click Next and complete the wizard.
- Once enabled, open IIS Manager and select the Web server.
Using the Request Monitor
Now that you have installed this feature, we can take a look at the information it provides:
- In the Web Server Home Features view, go to the IIS section and select and open the Worker Processes feature.
- Select the Desired worker process then, in the Actions pane, click View Current Requests (or right-click on the Worker Process and select View Current Requests .
Data that may warrant further investigation includes the following:
- Numerous requests for the same URL
- Requests from the same Client IP
- Long Time Elapsed values
- Certain requests that are using the Spira or Krono Desk API URLs
- Long running requests for large reports
For example, in one recent case, a large set of legacy system imports by multiple users in parallel, resulted in a magnitude more requests than was expected. Being able to identify the URL allowed the customer to take action that alleviated the performance impact.