Create a report:
This article assumes you are familiar with the basics of writing custom reports in Spira.
In this example we will build a custom report with custom ESQL section.
To create the report you need to:
- Go to Administration > Edit Reports
- Click on Create a new Report (at the bottom of the list of existing Reports)
- Specify HTML format (the dynamic elements won't work in Word/PDF/Excel)
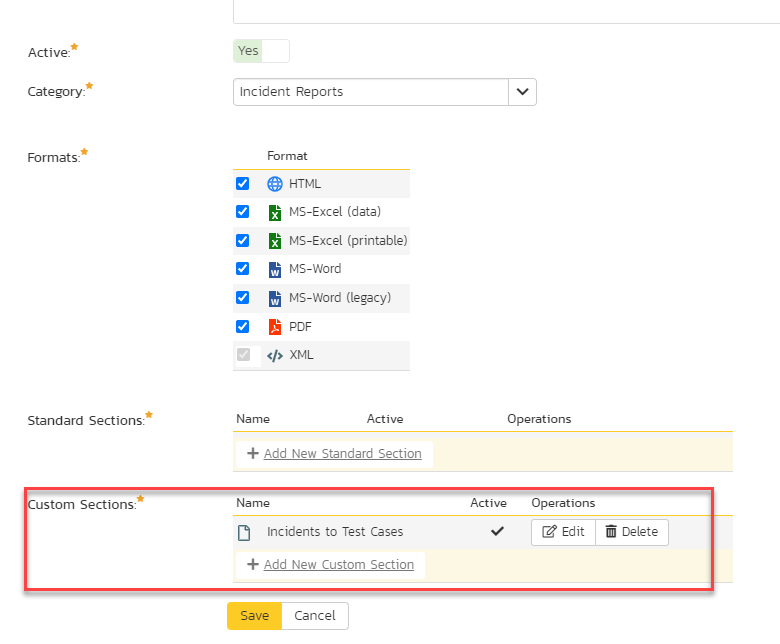
- Choose to add a Custom Section:
SQL Query:
5. Click Add New Custom Section and then
6. Copy and paste the below simple query to pull some incident information into the Query section of the window displayed:
SELECT
    I.INCIDENT_ID,
    I.NAME AS IncidentName,
    I.INCIDENT_STATUS_NAME,
    I.INCIDENT_TYPE_NAME,
    I.PRIORITY_NAME
FROM
    SpiraTestEntities.R_Incidents AS I
7. You can click Preview Results button to see the sample of the results.
8. If you will click on Generate Default Template button, you will get a normal report as a table of data. It will be a five-column table with incident info: IncidentID, Incident Name, its status, type and priority and that will also work for reporting purposes after saving changes.
Default template modification:
9. If you replace default template with the one from below, you will get the standard output plus the Export to Excel button on the top of the table:
<?xml version="1.0" encoding="utf-8"?>
<xsl:stylesheet version="1.0" xmlns:xsl="http://www.w3.org/1999/XSL/Transform" xmlns:msxsl="urn:schemas-microsoft-com:xslt" exclude-result-prefixes="msxsl">
<xsl:template match="/RESULTS">
<style>
<![CDATA[
.report-table { width: 100%; border-collapse: collapse; font-family: 'Segoe UI', sans-serif; font-size: 13px; }
.report-table th { background-color: #2c3e50; color: white; padding: 8px 12px; text-align: left; }
.report-table td { padding: 6px 12px; border-bottom: 1px solid #ddd; }
.report-table tr:nth-child(even) { background-color: #f8f9fa; }
.report-table tr:hover { background-color: #e8f4fd; }
.export-buttons { margin: 10px 0; display: flex; gap: 10px; }
.export-buttons button { padding: 8px 16px; cursor: pointer; border: none; border-radius: 4px; font-size: 13px; font-weight: 600; }
.btn-excel { background: #217346; color: white; }
.btn-pdf { background: #c0392b; color: white; }
.btn-excel:hover { background: #1a5c38; }
.btn-pdf:hover { background: #a93226; }
]]>
</style>
<div class="export-buttons">
<button class="btn-excel" onclick="exportToExcel()">📄 Export to Excel</button>
<button class="btn-pdf" onclick="exportToPDF()">🗎 Print / Save as PDF</button>
</div>
<table class="report-table" id="report-table">
<tr>
<th>ID</th>
<th>Name</th>
<th>Status</th>
<th>Priority</th>
<th>Severity</th>
<th>Owner</th>
<th>Opener</th>
<th>Created</th>
<th>Closed</th>
</tr>
<xsl:for-each select="ROW">
<tr>
<td><xsl:value-of select="INCIDENT_ID"/></td>
<td><xsl:value-of select="NAME"/></td>
<td><xsl:value-of select="INCIDENT_STATUS_NAME"/></td>
<td><xsl:value-of select="PRIORITY_NAME"/></td>
<td><xsl:value-of select="SEVERITY_NAME"/></td>
<td>
<xsl:choose>
<xsl:when test="OWNER_NAME != ''"><xsl:value-of select="OWNER_NAME"/></xsl:when>
<xsl:otherwise>Unassigned</xsl:otherwise>
</xsl:choose>
</td>
<td><xsl:value-of select="OPENER_NAME"/></td>
<td><xsl:value-of select="substring(CREATION_DATE, 1, 10)"/></td>
<td>
<xsl:choose>
<xsl:when test="CLOSED_DATE != ''"><xsl:value-of select="substring(CLOSED_DATE, 1, 10)"/></xsl:when>
<xsl:otherwise>-</xsl:otherwise>
</xsl:choose>
</td>
</tr>
</xsl:for-each>
</table>
<script>
<![CDATA[
function exportToExcel() {
  var table = document.getElementById('report-table');
  var blob = new Blob([table.outerHTML], { type: 'application/vnd.ms-excel' });
  var url = URL.createObjectURL(blob);
  var a = document.createElement('a');
  a.href = url;
  a.download = 'report.xls';
  document.body.appendChild(a);
  a.click();
  document.body.removeChild(a);
  URL.revokeObjectURL(url);
}

function exportToPDF() {
  var buttons = document.querySelector('.export-buttons');
  buttons.style.display = 'none';
  window.print();
  buttons.style.display = 'flex';
}
]]>
</script>
</xsl:template>
</xsl:stylesheet>
Modification explanations:
exportToExcel() Function is the most dynamic part of the code and where the JavaScript comes in. It provides a simple, client-side solution for saving the report.
exportToExcel() Function: This function is triggered by the button's onclick event. It's a clever hack that works by generating a new HTML document formatted specifically for a spreadsheet application like Excel.
Creating the HTML: The script gets the HTML content of the table (table.outerHTML) and the styles from the <style> tag. It then combines them into a full HTML string with special XML namespaces (xmlns:o and xmlns:x) that tells Excel to interpret the content as a spreadsheet.
Triggering the Download: Finally, the script creates a Blob object from the generated HTML string. It then uses a temporary <a> element to create a downloadable link. This process tricks the browser into downloading the file with an .xls extension, allowing Excel to open it.
ExportToPDF() Function: This function is triggered by the button's onclick event. Unlike the Excel export, it doesn't generate a new document — instead, it leverages the browser's native Print dialog which includes a "Save as PDF" option
How to use the buttons
Export to Excel Button (green)
- Click the button
- A file called `incident_report.xls` will download immediately to your Downloads folder
- Open it in Excel or any spreadsheet application
Print / Save as PDF Button (red)
- Click the button
- Your browser's Print dialog will open
- In the printer/destination dropdown, select "Save as PDF" (or "Microsoft Print to PDF")
- Click Save or Print
- Choose where to save the file — it will be a real `.pdf` file
Tip: The buttons themselves will NOT appear in the PDF — they automatically hide during printing so your PDF looks clean.
How to Add These Buttons to Your Own Report
If you already have a working custom report and just want to add the export buttons, here's what to change:
1. Add the button styles
Inside your `<style>` section, add:
.export-buttons { margin: 10px 0; display: flex; gap: 10px; }
.export-buttons button { padding: 8px 16px; cursor: pointer; border: none; border-radius: 4px; font-size: 13px; font-weight: 600; }
.btn-excel { background: #217346; color: white; }
.btn-pdf { background: #c0392b; color: white; }
.btn-excel:hover { background: #1a5c38; }
.btn-pdf:hover { background: #a93226; }
2. Add the buttons HTML
Place this just above your `<table>` element:
<div class="export-buttons">
<button class="btn-excel" onclick="exportToExcel()">📄 Export to Excel</button>
<button class="btn-pdf" onclick="exportToPDF()">🗎 Print / Save as PDF</button>
</div>
3. Add the JavaScript
Place this just before the closing `</div>` at the end of your template (after the `</table>`):
<script>
<![CDATA[
function exportToExcel() {
var table = document.getElementById('report-table');
var blob = new Blob([table.outerHTML], { type: 'application/vnd.ms-excel' });
var url = URL.createObjectURL(blob);
var a = document.createElement('a');
a.href = url;
a.download = 'report.xls';
document.body.appendChild(a);
a.click();
document.body.removeChild(a);
URL.revokeObjectURL(url);
}
function exportToPDF() {
var buttons = document.querySelector('.export-buttons');
buttons.style.display = 'none';
window.print();
buttons.style.display = 'flex';
}
]]>
</script>
4. Make sure your table has an ID
The Excel export needs to find your table by ID. Make sure your `<table>` tag has `id="incident-table"`:
<table class="DataGrid" id="incident-table">
If you change this ID, also update the `document.getElementById('incident-table')` line in the JavaScript to match.
Sample output:
9. After that, the report is now ready for saving and running. Give the report a meaningful name and save it for further use.
10. Go to the product's report center and locate the newly created report. Click Generate and wait for the page to load. You should get something similar to this:
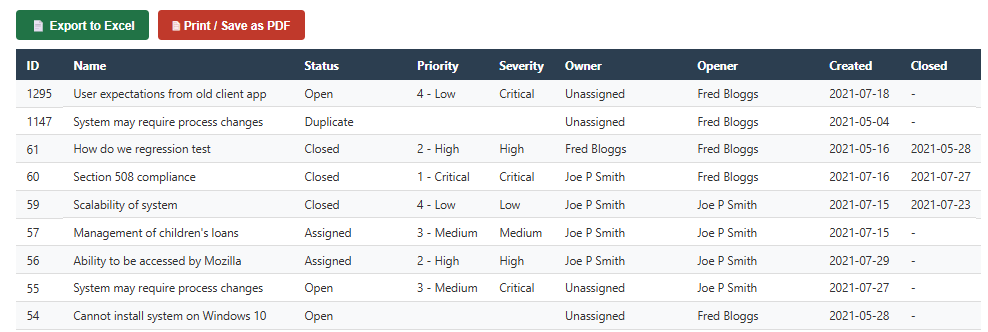
11. When you click on Export to Excel button the entire table will be exported as .xsl file and available for further use.
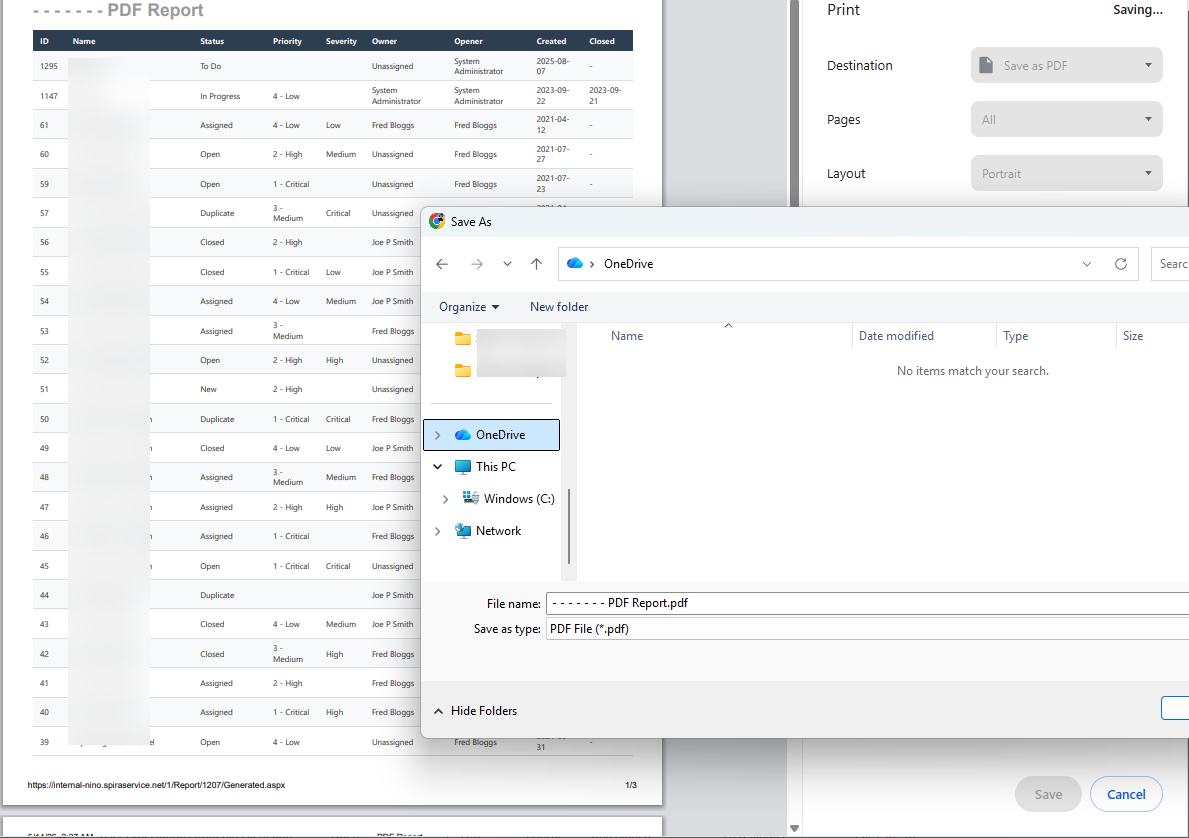
12. When you click on Print / Save as PDF button you will see the additional window so to specify saving location on your machine: