Background
In traditional SQL is quite simple to achieve grouping and aggregating, however ESQL has some limitations that may not allow you to get the data in desired format.
In this example, we want to get table of test cases and its linked requirements. This information is available in custom report view SpiraTestEntities.R_RequirementTestCases and easily can be pulled out.
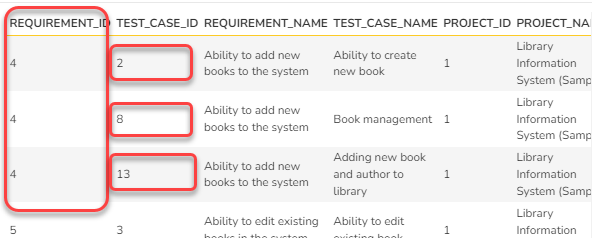
However, the view by default will list one row for each Requirements and Test Cases combination. In the image below we see 3 rows for the same requirement but with different test cases:

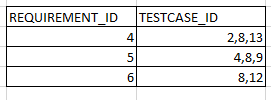
Ideally, we should be able to get one row for each item with aggregate results in a cell for those which has number of associated items:

Solution
Since ESQL version has only limited aggregation functionality, we can achieve exactly what we are after by modifying the XSLT template and aggregate the results that way.
So, the standard ESQL query will extract the information as described above, one row per record:
SELECT value R
FROM SpiraTestEntities.R_RequirementTestCases AS R
ORDER BY R.TEST_CASE_ID asc
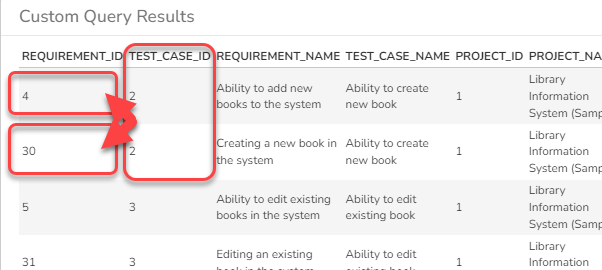
Once the default template created, you'll be able to see the data as-is:

So, Test Case with ID = 2 has two Requirements with ID=4 and ID=30.
Lets modify our ESQL query first so to get requirements and test cases only, filtering by the current product and ordering results ascending:
SELECT
   RTC.TEST_CASE_ID AS TC_ID,
   RTC.TEST_CASE_NAME AS TC_NAME,
   RTC.REQUIREMENT_ID AS RQ_NAME,
   RTC.REQUIREMENT_NAME AS REQUIREMENT
FROM SpiraTestEntities.R_RequirementTestCases AS RTC
WHERE
RTC.PROJECT_ID = ${ProjectId}
ORDER BY RTC.TEST_CASE_ID asc
The result will be the same in terms of number of rows - duplicate items will be displayed for Test Cases (if there are more than one requirement associated).
Modifying XSLT
The reason for modification is to get only one row per test case with all associated requirements grouped.
For that, copy and paste the XSLT template in the corresponding Template text box under the custom query:
<?xml version="1.0" encoding="utf-8"?>
<xsl:stylesheet version="1.0" xmlns:xsl="http://www.w3.org/1999/XSL/Transform" xmlns:msxsl="urn:schemas-microsoft-com:xslt" exclude-result-prefixes="msxsl">
  <xsl:output method="xml" indent="yes"/>
  <xsl:key name="groups" match="/RESULTS/ROW" use="ID" />
  <xsl:template match="/RESULTS">
  	<table class="DataGrid">
  		<colgroup>
	     <col width="45px"/>
	     <col width="215px"/>
	     <col width="45px"/>
	     <col width="215px"/>
	   	</colgroup>
		<tr>
			<th>TEST_CASE_ID</th>
			<th>TEST_CASE_NAME</th>
			<th>REQUIREMENT_ID</th>
			<th>REQUIREMENT</th>
		</tr>
    	<xsl:apply-templates select="ROW[generate-id() = generate-id(key('groups', ID)[1])]"/>
    </table>
  </xsl:template>
  <xsl:template match="ROW">
      <tr id="{ID}">
          <td valign="top">
          	<table>
		        <tr>
		          <td valign="top" style="border: 0;">TC:<xsl:value-of select="ID"/></td>
		        </tr>

		 	</table>
          </td>
          <td valign="top"><xsl:value-of select="NAME"/></td>
          <td valign="top">
          	<xsl:if test="REQUIREMENT != ''">
	          	<table>
			      <xsl:for-each select="key('groups', ID)">
			        <tr>
			          <td valign="top" style="border: 0;">RQ:<xsl:value-of select="REQUIREMENT_ID"/></td>
			        </tr>
			       </xsl:for-each>
			 	</table>
			 	<td valign="top">
				<table>
			      <xsl:for-each select="key('groups', ID)">
			        <tr>
			          <td valign="top" style="border: 0;"><xsl:value-of select="REQUIREMENT"/></td>
			        </tr>
			       </xsl:for-each>
			 	</table>
			 </td>
		 	</xsl:if>
          </td>
        </tr>
  </xsl:template>
</xsl:stylesheet>
Click Save button in both windows and now your custom report is ready for use.
Sample
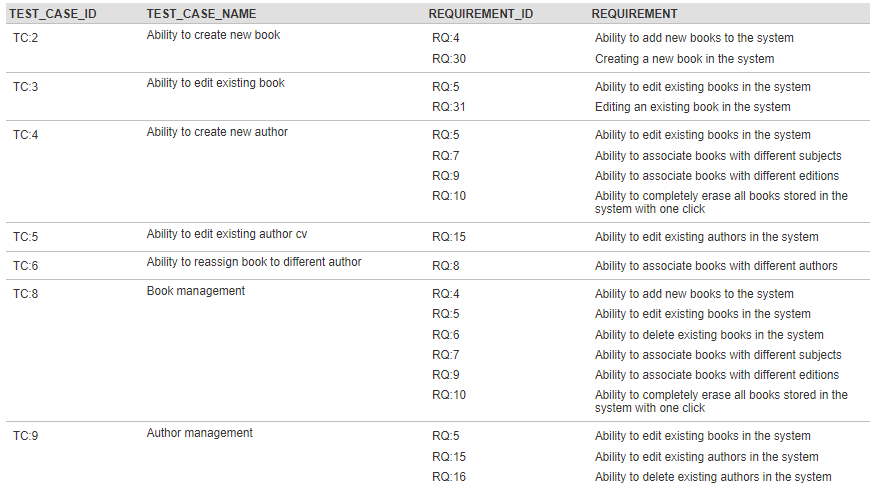
The sample report can be ran from the Report Center and it should be similar to the example below:
