Custom Graph Query
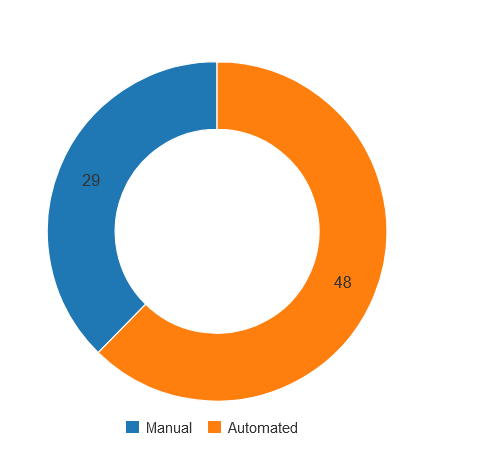
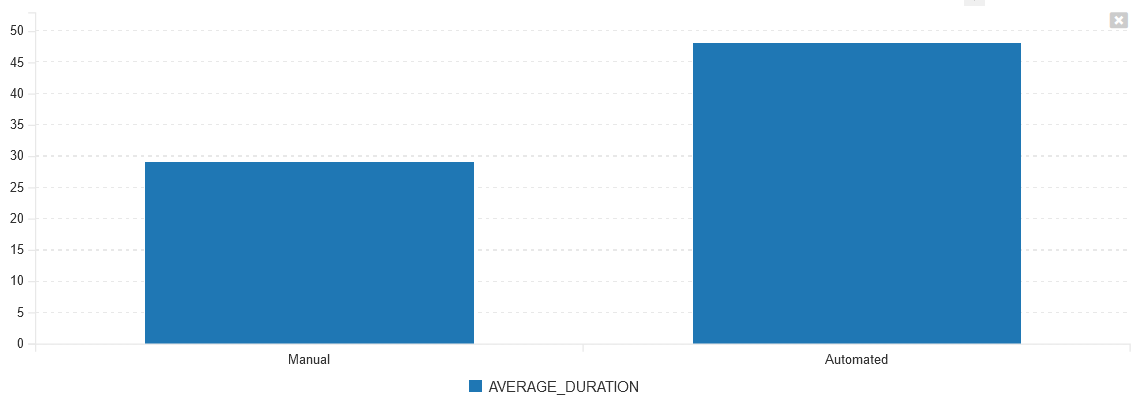
To create a simple graph of the actual duration time for manual vs. automated test runs for a specific project, you can use the following query:
(select 'Automated' as Type, avg(TR.ACTUAL_DURATION) as AVERAGE_DURATION
from SpiraTestEntities.R_TestRuns as TR
where TR.PROJECT_ID = ${ProjectId} and TR.TEST_RUN_TYPE_NAME = 'Automated')
union
(select 'Manual' as Type, avg(TR.ACTUAL_DURATION) as AVERAGE_DURATION
from SpiraTestEntities.R_TestRuns as TR
where TR.PROJECT_ID = ${ProjectId} and TR.TEST_RUN_TYPE_NAME = 'Manual')
Note that this is a simple query that simply averages all test runs for automated vs. manual execution. You can modify the query to only look at specific types, statuses, etc. as well.
Sample Output
When you run this report you will get:

or if you prefer a bar chart:
