Example: Test Runs by Status for a Release
In this example, we will show you how to create a simple donut Graph of incidents that are part of Component 1 in the current project. The graph will be a donut Graph with current incidents status as the 'axis', filtered by the specific project, component, and the IS_ACTIVE_STATUS flag set to True.
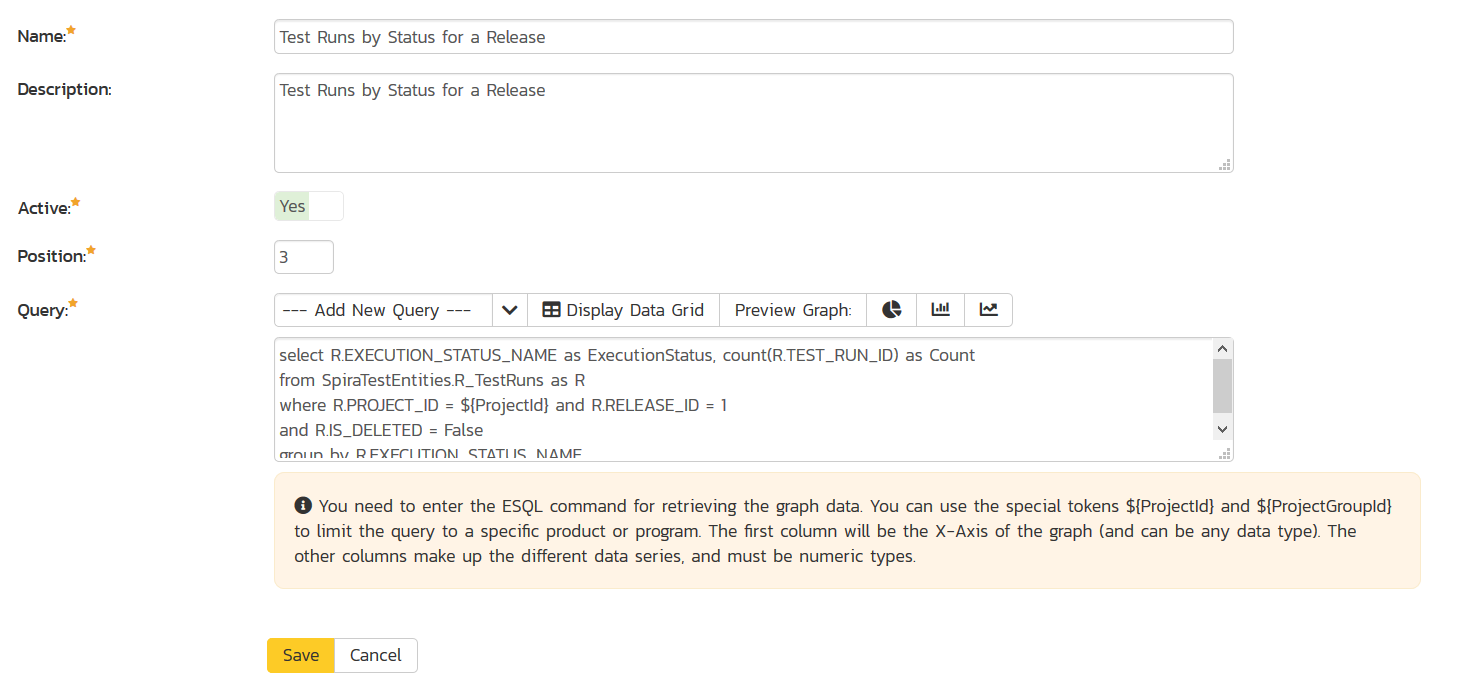
Using the option to Create a Custom Graph, we entered this information:
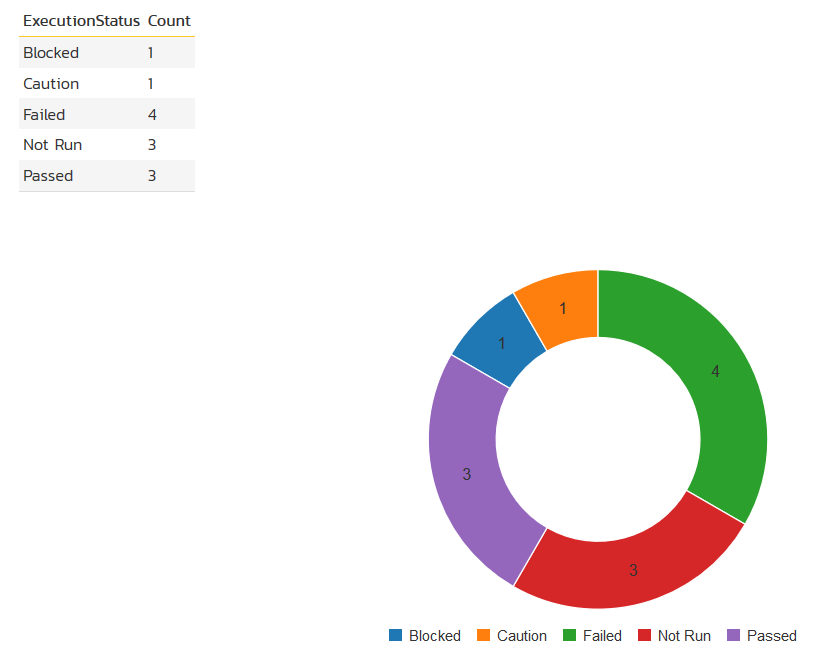
This then gave the following data grid and donut graph:
The actual Entity SQL we used was this:
select R.EXECUTION_STATUS_NAME as ExecutionStatus, count(R.TEST_RUN_ID) as Count
from SpiraTestEntities.R_TestRuns as R
where R.PROJECT_ID = ${ProjectId} and R.RELEASE_ID = 1
and R.IS_DELETED = False
group by R.EXECUTION_STATUS_NAME
Which is hard-coded to filter on Release ID = 1.
In future releases of Spira (v6.4 and newer) you will be able to use the new ${ReleaseId} field to specify the current release, rather than hard-coding it.