Displaying the Data in a Graph
If you go to the Reports center in SpiraTeam, you can display various graphs:
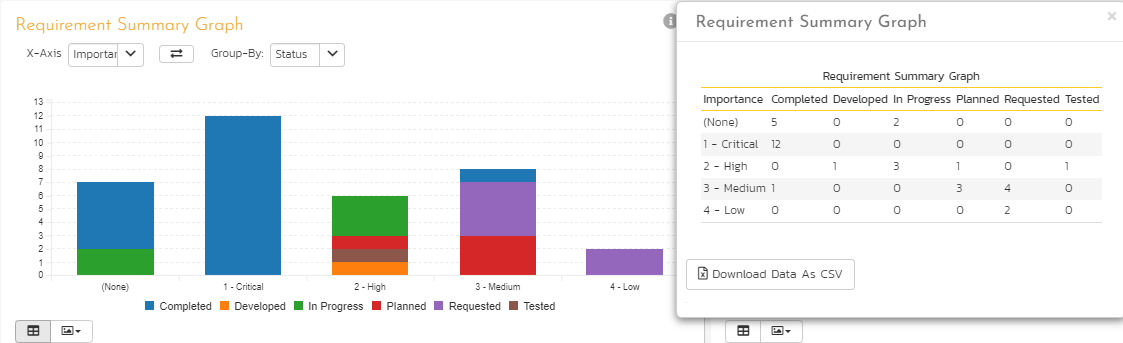
When you choose the option to Download Data as CSV, the web browser makes a request to get the data as a CSV file. Sometimes users want to be able to extract that data programmatically for use in a web portal or other application.
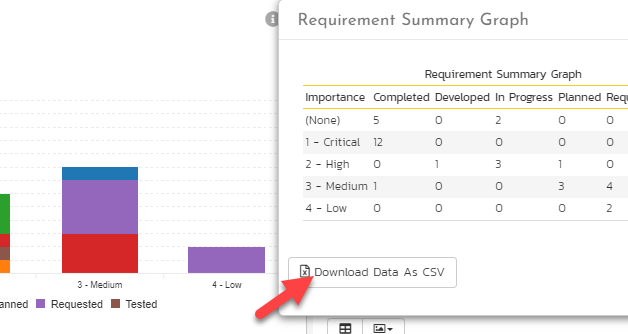
Extracting the Graph CSV Data
To get the same data in CSV format (the Excel table), you just need to click on Download Data As CSV button under the values grid:
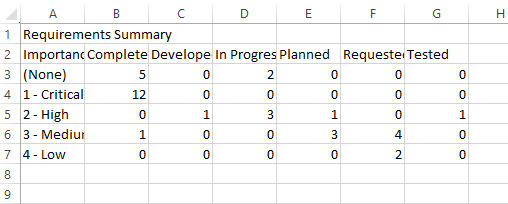
The file will be downloaded in the browser’s default download folder and look like below: