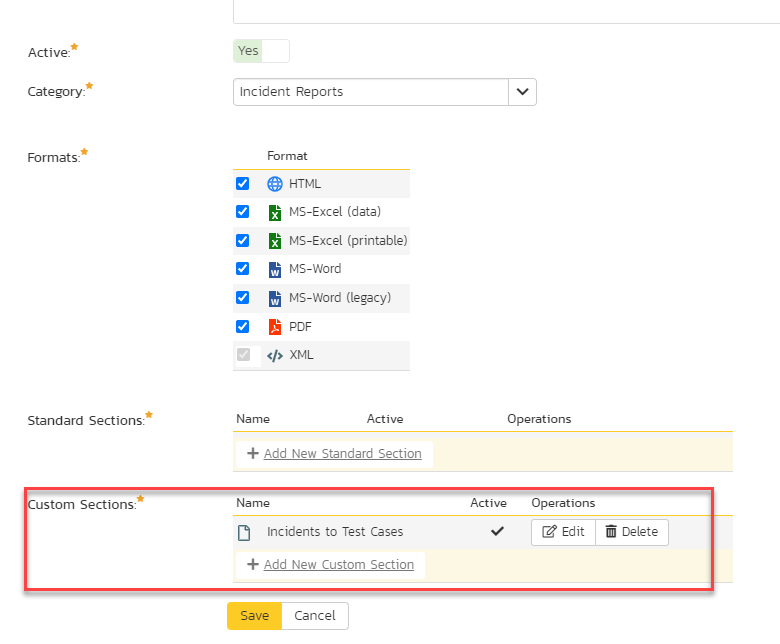
Create a report:
This article assumes you are familiar with the basics of writing custom graphs in Spira.
In this example we will be using a custom report with a custom ESQL section.
To create the report you need to:
- Go to Administration > Edit Graphs
- Click on Add a New Custom Graph (at the bottom of the list of existing graphs)
- Give it a meaningful name
- Copy and paste below ESQL code into the Query section:
SQL Query:
5. Paste into the Query section the query itself and then Save it:
(SELECT
    'PENDING' AS StatusCategory,
    COUNT(DISTINCT CASE WHEN TR.EXECUTION_STATUS_NAME = 'NOT RUN' AND TR.END_DATE IS NULL THEN TR.TEST_RUN_ID END) AS TestCount
FROM SpiraTestEntities.R_TestRuns as TR
WHERE TR.PROJECT_ID = ${ProjectId})

UNION ALL

(SELECT
    'COMPLETED' AS StatusCategory,
    COUNT(DISTINCT CASE WHEN TR.END_DATE IS NOT NULL THEN TR.TEST_RUN_ID END) AS TestCount
FROM SpiraTestEntities.R_TestRuns as TR
WHERE TR.PROJECT_ID = ${ProjectId})

UNION ALL

(SELECT
'NOT_RUN' AS StatusCategory,
COUNT(DISTINCT TC.TEST_CASE_ID) AS TestCount
FROM SpiraTestEntities.R_TestCases AS TC
WHERE NOT EXISTS (SELECT 1 FROM SpiraTestEntities.R_TestRuns AS TR_SUB WHERE TR_SUB.TEST_CASE_ID = TC.TEST_CASE_ID) AND TC.PROJECT_ID = ${ProjectId}
)
Query Explanation:
The fist SELECT statement counts number of test runs that exist for the test run IDs being counting and have no value in END DATE (not finished e.g. pending).
The second SELECT statement counts all test runs that have a value in the END DATE (e.g. completed with any status).
The last SELECT statement counts test cases that have no test runs associated with any test case ID in the count function.
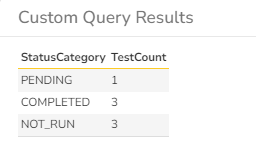
Running the query
To run the query and see the results in the table view - click on Preview Results button. The sample output of that action looks like this:
Do not forget to Generate Default Template of simply insert the XSLT template from the below snippet:
<?xml version="1.0" encoding="utf-8"?>
<xsl:stylesheet version="1.0" xmlns:xsl="http://www.w3.org/1999/XSL/Transform" xmlns:msxsl="urn:schemas-microsoft-com:xslt" exclude-result-prefixes="msxsl">
  <xsl:template match="/RESULTS">
    <table class="DataGrid"><tr><th>StatusCategory</th><th>TestCount</th></tr>
      <xsl:for-each select="ROW">
        <tr><td><xsl:value-of select="StatusCategory"/></td><td><xsl:value-of select="TestCount"/></td>
        </tr>
      </xsl:for-each>
        </table>
    </xsl:template>
</xsl:stylesheet>
Click Save button twice.
Now this custom report is available for all the users that have access to Report center.