Create a report:
This article assumes you are familiar with the basics of writing custom reports in Spira.
In this example we will build a custom report with custom ESQL section.
To create the report you need to:
- Go to Administration > Edit Reports
- Click on Create a new Report (at the bottom of the list of existing Reports)
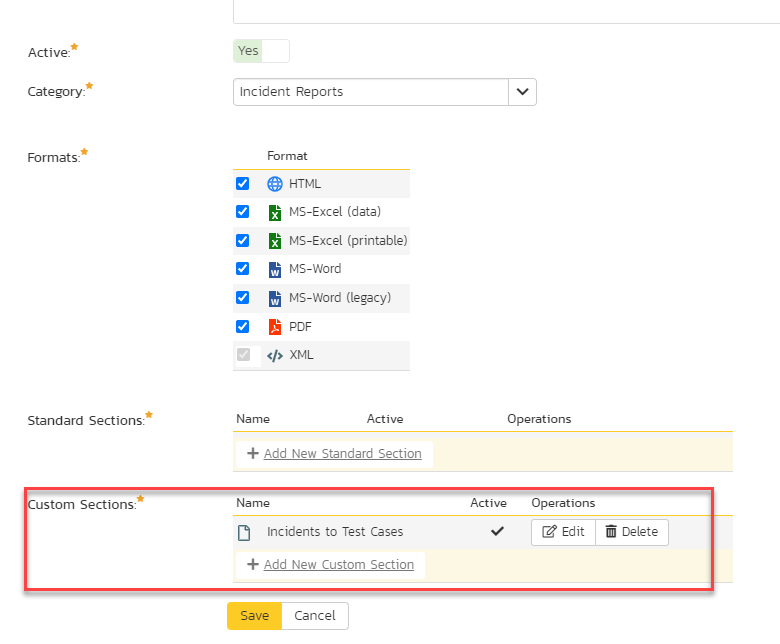
- Specify that it should allow generation in MS-Word, Excel, HTML and PDF formats
- Choose to add a Custom Section:
SQL Query:
1. Insert below ESQL query:
SELECT RL.NAME AS RELEASE_NAME,
RL.TASK_COUNT,
RL.TASK_ESTIMATED_EFFORT AS Est,
RL.TASK_PROJECTED_EFFORT AS Proj,
RL.TASK_PERCENT_NOT_START,
RL.TASK_PERCENT_LATE_START,
RL.TASK_PERCENT_LATE_FINISH,
RL.TASK_PERCENT_ON_TIME
FROM SpiraTestEntities.R_Releases AS RL
where RL.PROJECT_ID = ${ProjectId}
The output of this will be the content of the R_Releases custom report view for current product and this is the same output as displayed by Release Task progress widget from the Product home page.
We can slightly modify the default XSLT template so to have an inline graphical representation of the progress.
Insert the following modified XSLT code into Template section (or just click on Create Default Template if you do not need inline graph):
<?xml version="1.0" encoding="utf-8"?>
<xsl:stylesheet version="1.0" xmlns:xsl="http://www.w3.org/1999/XSL/Transform" xmlns:msxsl="urn:schemas-microsoft-com:xslt" exclude-result-prefixes="msxsl">
  <xsl:template match="/RESULTS">
    <table class="DataGrid" width="600">
      <tr>
        <th width="50%">RELEASE_NAME</th>
        <th>TASK_COUNT</th>
        <th>Est</th>
        <th>Proj</th>
        <th>TASK_PERCENT_NOT_START</th>
        <th>TASK_PERCENT_LATE_START</th>
        <th>TASK_PERCENT_LATE_FINISH</th>
        <th>TASK_PERCENT_ON_TIME</th>
        <th width="50%">GRAPH</th>
      </tr>
      <xsl:for-each select="ROW">
        <tr>
          <td>
            <xsl:value-of select="RELEASE_NAME"/>
          </td>
        <td>
          <xsl:value-of select="TASK_COUNT"/>
        </td>
        <td>
          <xsl:value-of select="Est"/>
        </td>
        <td>
          <xsl:value-of select="Proj"/>
        </td>
        <td>
          <xsl:value-of select="TASK_PERCENT_NOT_START"/>
        </td>
        <td>
          <xsl:value-of select="TASK_PERCENT_LATE_START"/>
        </td>
        <td>
          <xsl:value-of select="TASK_PERCENT_LATE_FINISH"/>
        </td>
        <td>
          <xsl:value-of select="TASK_PERCENT_ON_TIME"/>
        </td>
        <td>
           <div>
            <xsl:attribute name="style">display:inline-block; background-color:red; height: 20px; width:<xsl:value-of select="TASK_PERCENT_NOT_START * 100 div (TASK_PERCENT_NOT_START + TASK_PERCENT_LATE_START + TASK_PERCENT_LATE_FINISH + TASK_PERCENT_ON_TIME)"/>px</xsl:attribute>
          </div>
          <div>
            <xsl:attribute name="style">display:inline-block; background-color:orange; height: 20px; width:<xsl:value-of select="TASK_PERCENT_LATE_START * 100 div (TASK_PERCENT_NOT_START + TASK_PERCENT_LATE_START + TASK_PERCENT_LATE_FINISH + TASK_PERCENT_ON_TIME)"/>px</xsl:attribute>
          </div>
           <div>
            <xsl:attribute name="style">display:inline-block; background-color:green; height: 20px; width:<xsl:value-of select="TASK_PERCENT_LATE_FINISH * 100 div (TASK_PERCENT_NOT_START + TASK_PERCENT_LATE_START + TASK_PERCENT_LATE_FINISH + TASK_PERCENT_ON_TIME)"/>px</xsl:attribute>
          </div>
          <div>
            <xsl:attribute name="style">display:inline-block; background-color:lime; height: 20px; width:<xsl:value-of select="TASK_PERCENT_ON_TIME * 100 div (TASK_PERCENT_NOT_START + TASK_PERCENT_LATE_START + TASK_PERCENT_LATE_FINISH + TASK_PERCENT_ON_TIME)"/>px</xsl:attribute>
          </div>
        </td>
        </tr>
      </xsl:for-each>
        </table>
    </xsl:template>
</xsl:stylesheet>
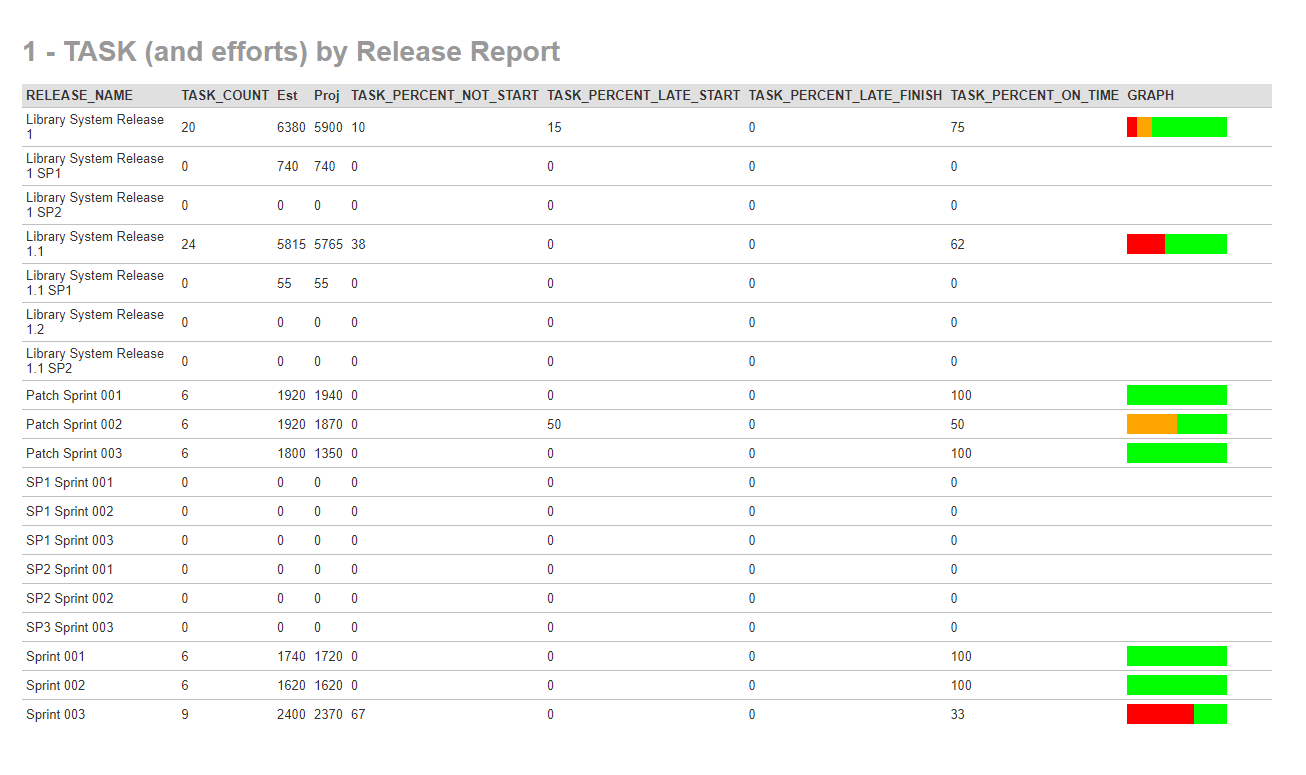
Running the report and expected output
As a result of the report execution you should get something like: