1. Create a Graph
First, you need to create a Custom Graph :
- Go to Administration > Edit Graphs
- Click Add New Custom Graph
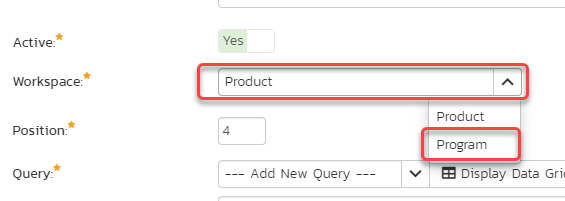
- Specify that it applies to the Program
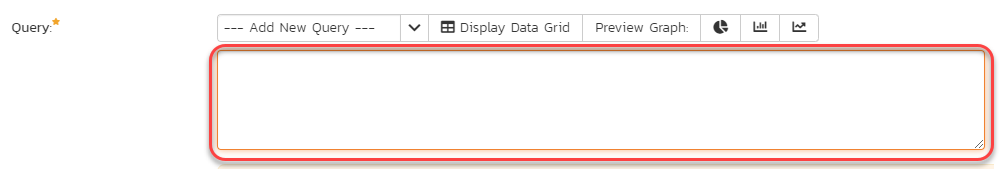
- Insert the ESQL query into the Query section
2. Building a sample Capability counter graph
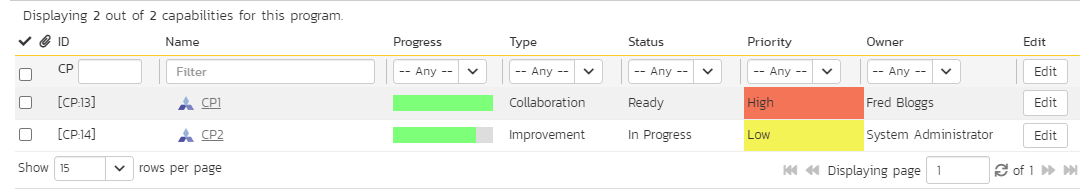
Given you need to have a custom graph that displays Capability priority counter per Program - basically saying how many Capabilities we have, split by Priority.
In this case, we have two capabilities with High and Low priorities, respectively:
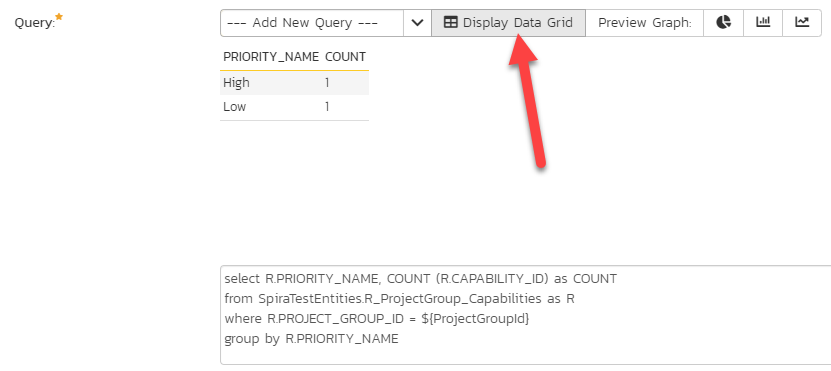
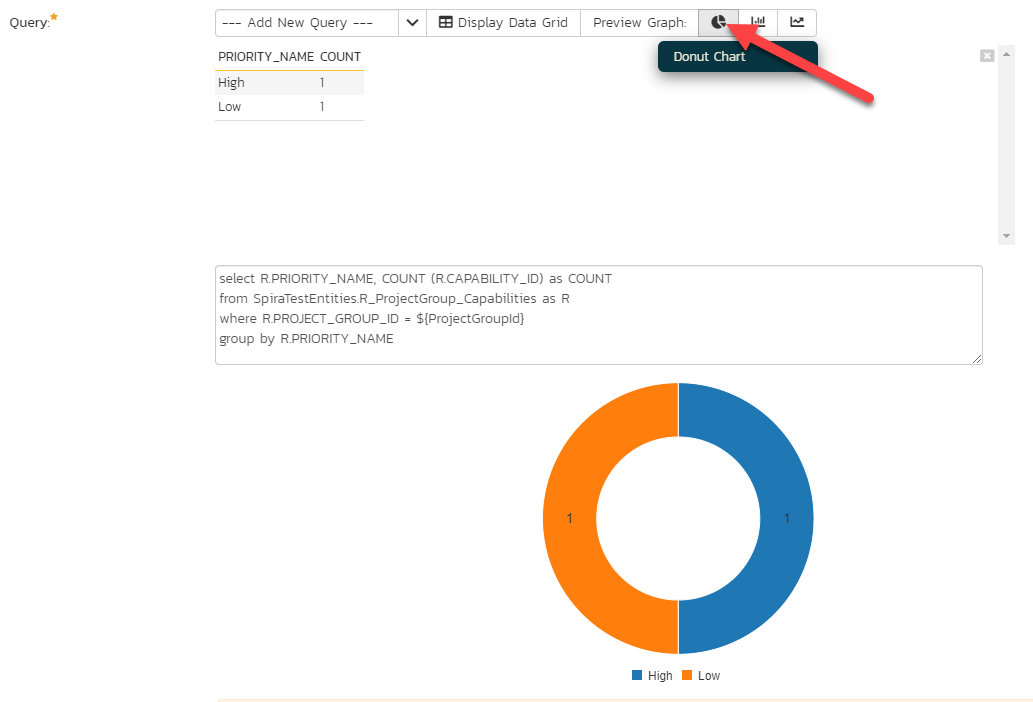
1. Insert the following query in the Query box:
select R.PRIORITY_NAME, COUNT (R.CAPABILITY_ID) as COUNT
from SpiraTestEntities.R_ProjectGroup_Capabilities as R
where R.PROJECT_GROUP_ID = ${ProjectGroupId}
group by R.PRIORITY_NAME
2. Click Preview Data Grid - it displays that there is one capability with priority High and the other one with priority Low:
3. You can preview the graph here in three different formats - donut, bars, and line chart:
4. Click Save
Add the Graph to the Program Reporting workspace
5. Go to the Program workspace
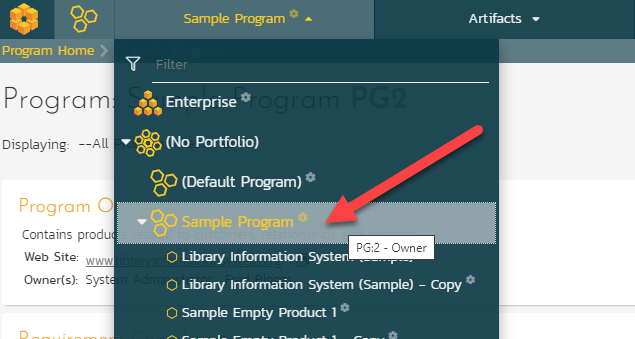
6. Select Reporting from the main menu
7. Click the little plus button to add a new item on the board, find a graph, and select it:
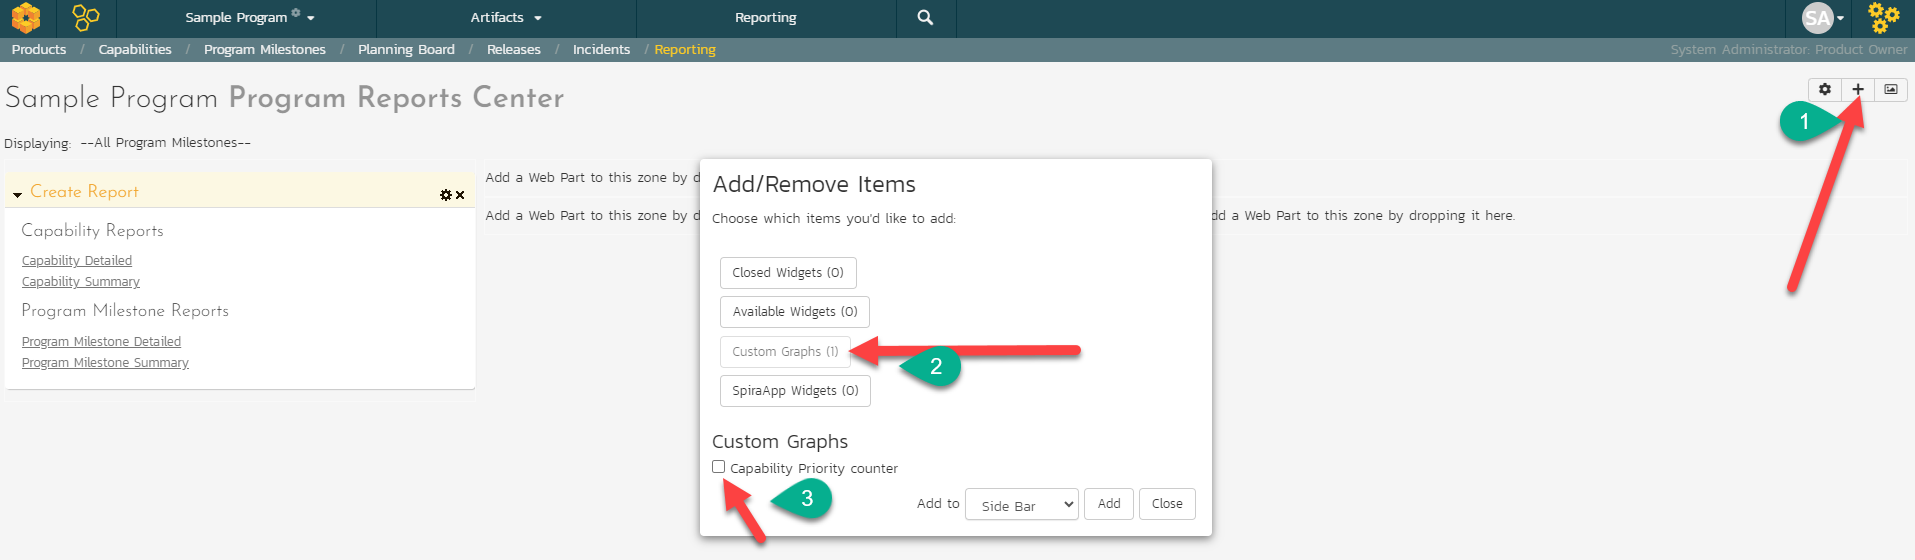
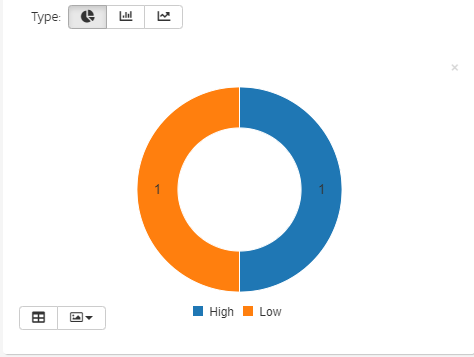
8. You'll get the graph on the Program reporting page:
3. Building a milestones status counter per program Custom Graph
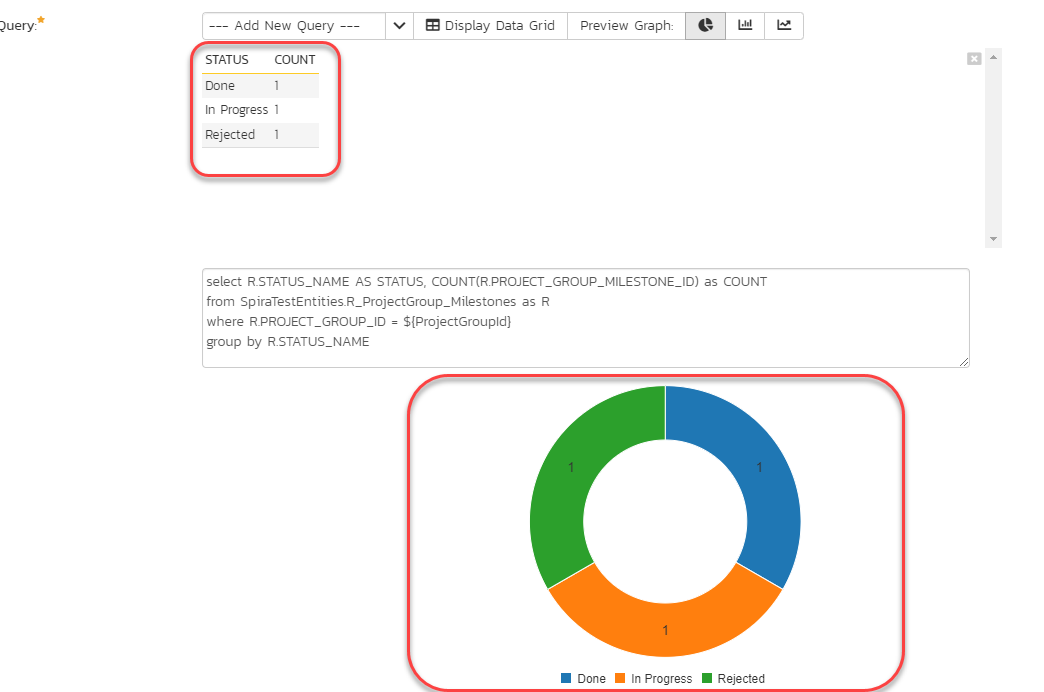
Here is a sample query to bring up a graph for Program Milestones to count the items per status:
select R.STATUS_NAME AS STATUS, COUNT(R.PROJECT_GROUP_MILESTONE_ID) as COUNT
from SpiraTestEntities.R_ProjectGroup_Milestones as R
where R.PROJECT_GROUP_ID = ${ProjectGroupId}
group by R.STATUS_NAME
The result of that query execution would be the list of milestones with their statuses (considering we have three milestones defined at the Program level):
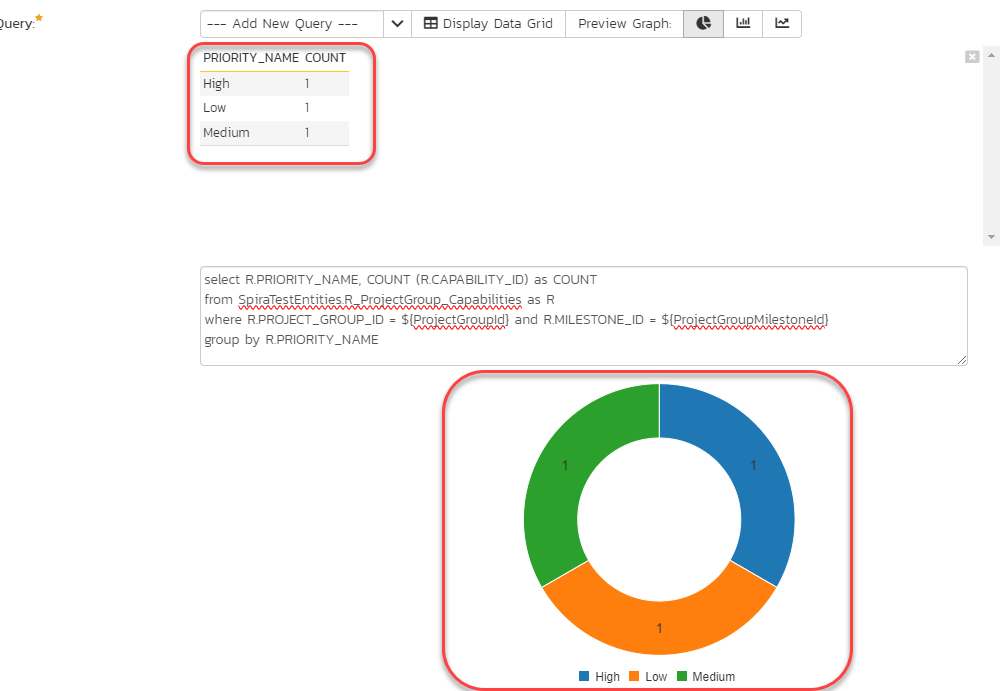
4. Capability Priority Counter per Milestone
This query should be used to display the count of capability priorities for each milestone you have for the given Program:
select R.PRIORITY_NAME, COUNT (R.CAPABILITY_ID) as COUNT
from SpiraTestEntities.R_ProjectGroup_Capabilities as R
where R.PROJECT_GROUP_ID = ${ProjectGroupId} and R.MILESTONE_ID = ${ProjectGroupMilestoneId}
group by R.PRIORITY_NAME
Given we now have five capabilities in our Program and only 3 of them have a milestone defined:
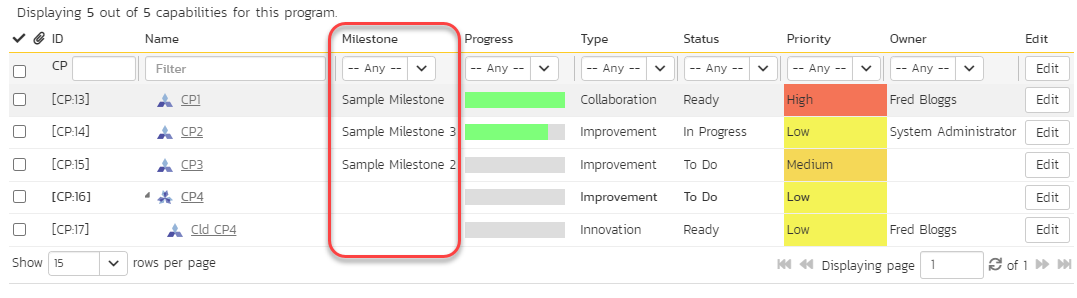
The query execution will count only those of the capabilities that have a milestone added:
To add graphs on the Program reporting workspace refer to the Add the Graph to the Program Reporting Workspace section of this article