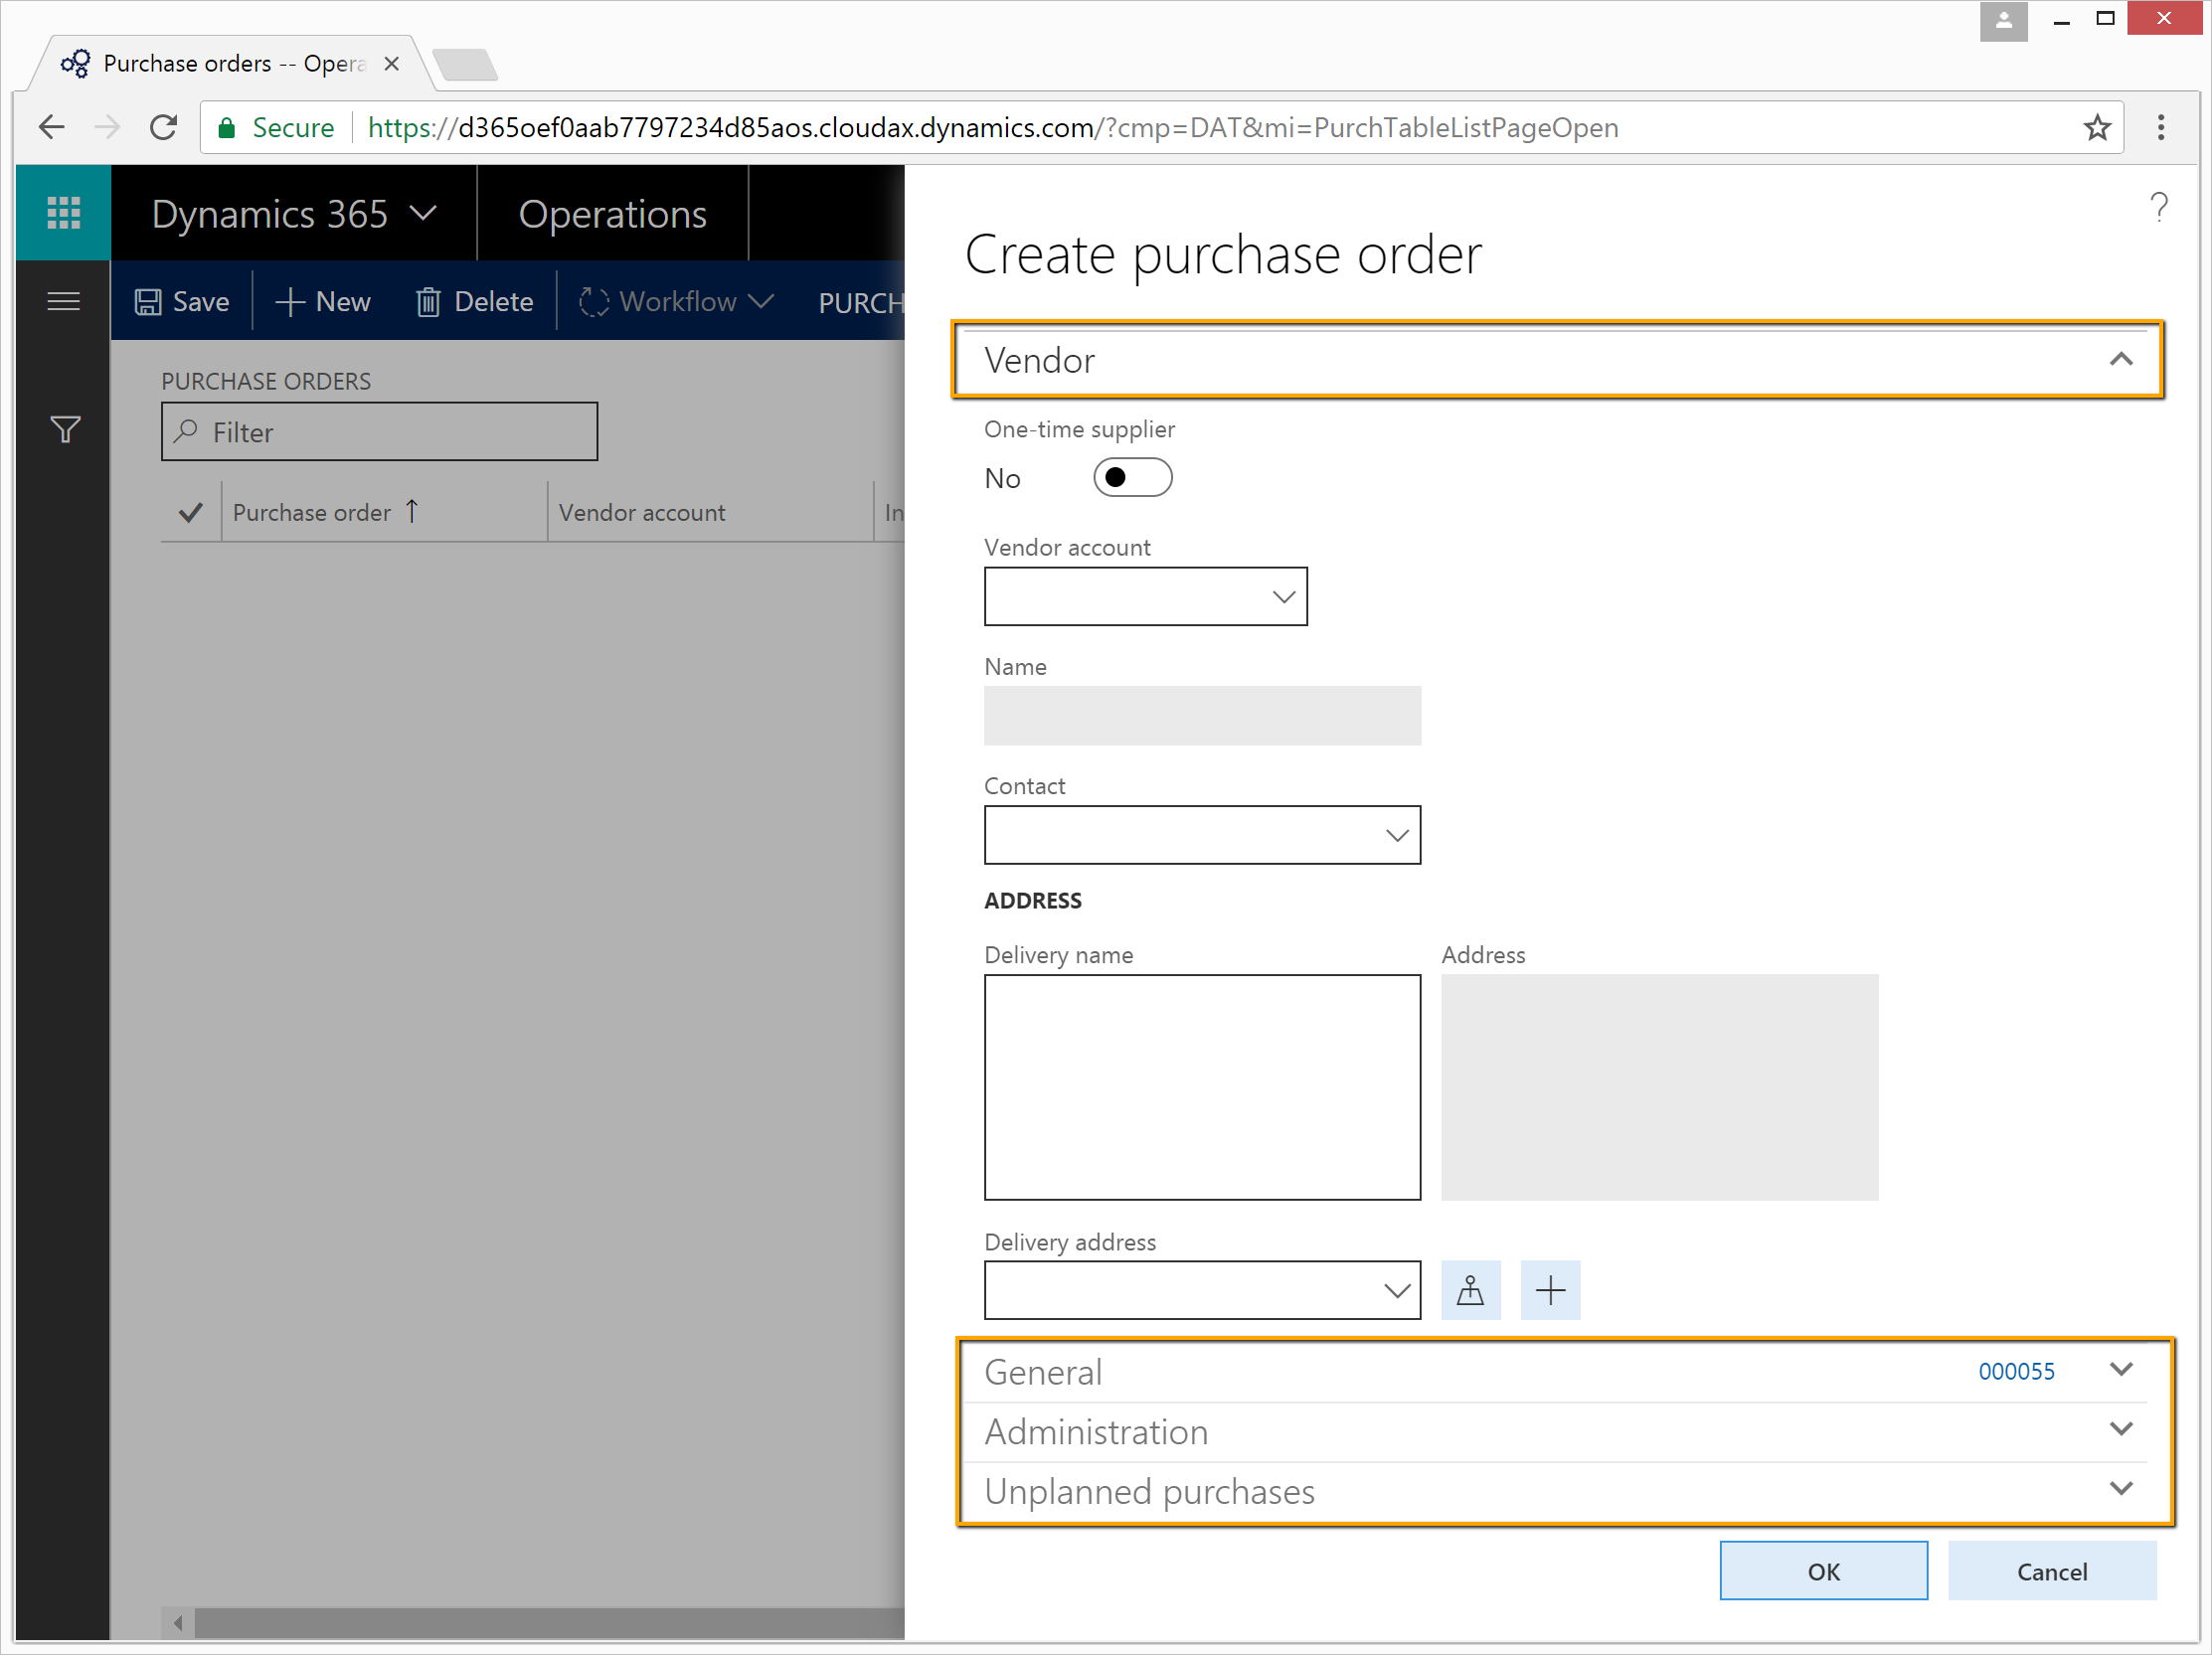
Open your application in Chrome. In our example it is Dynamics 365 for Operations (ERP system from Microsoft). Let's debug how Rapise records clicks on the tab control headers.
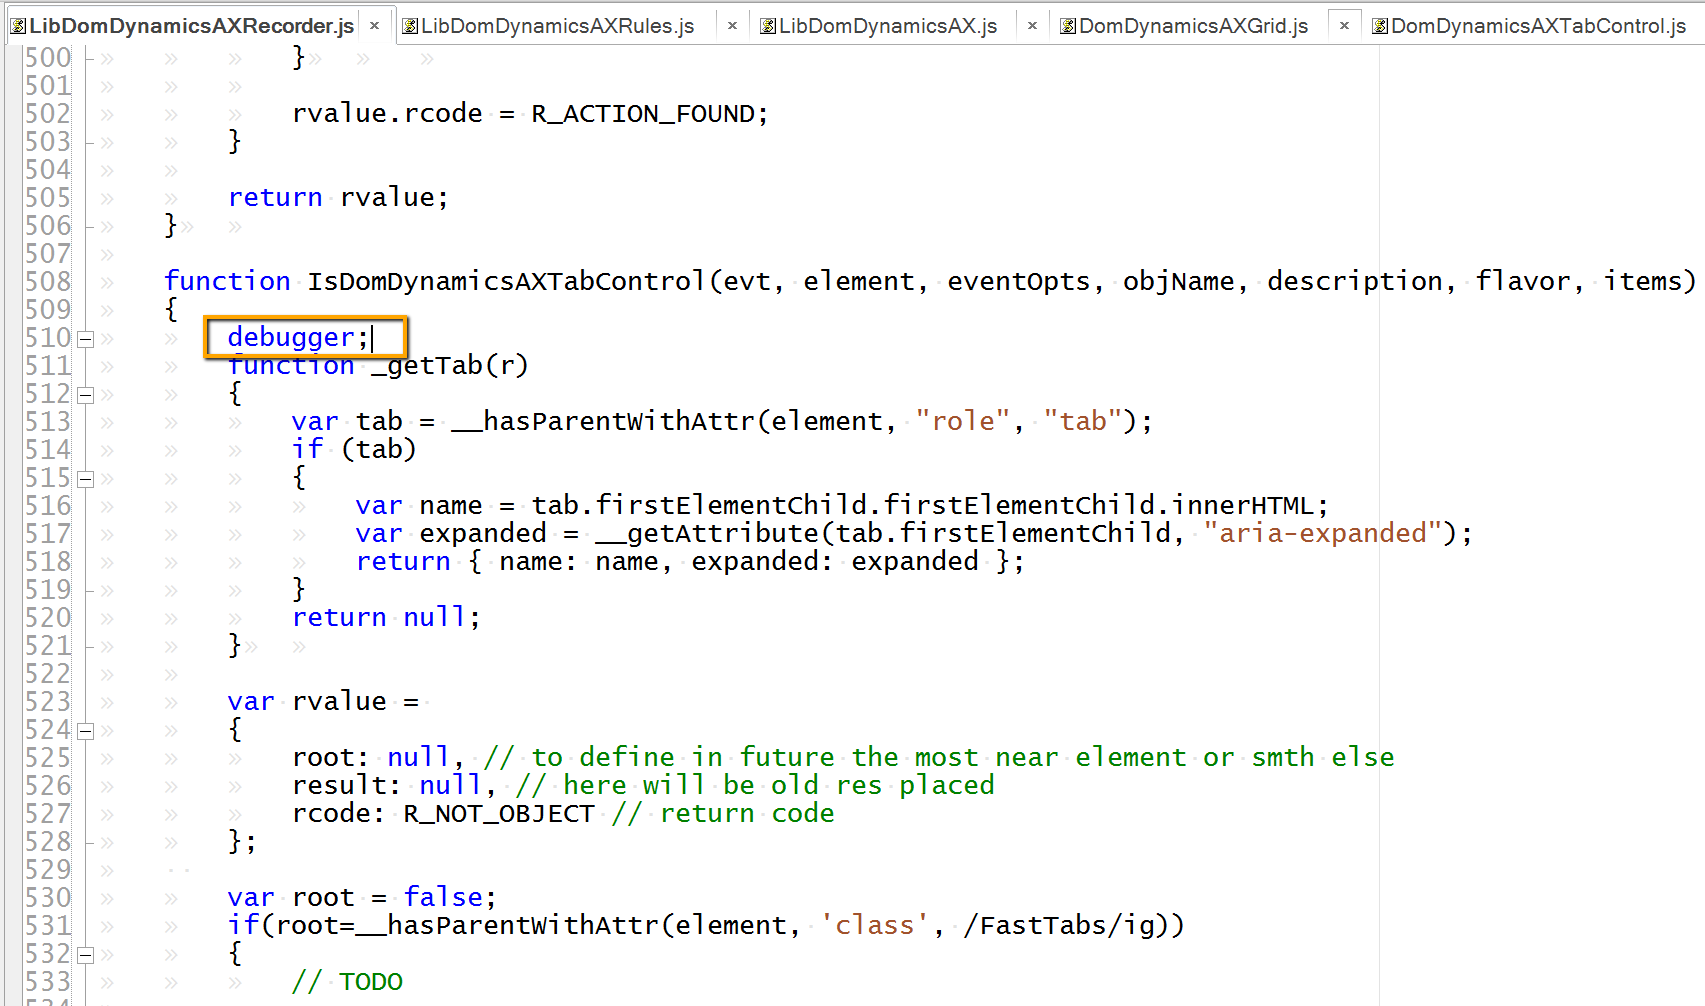
Here is the part of the source code we want to debug. Write
debugger;
statement at a place were you want to break execution and start debugging.
Download and install VS Code from https://code.visualstudio.com/
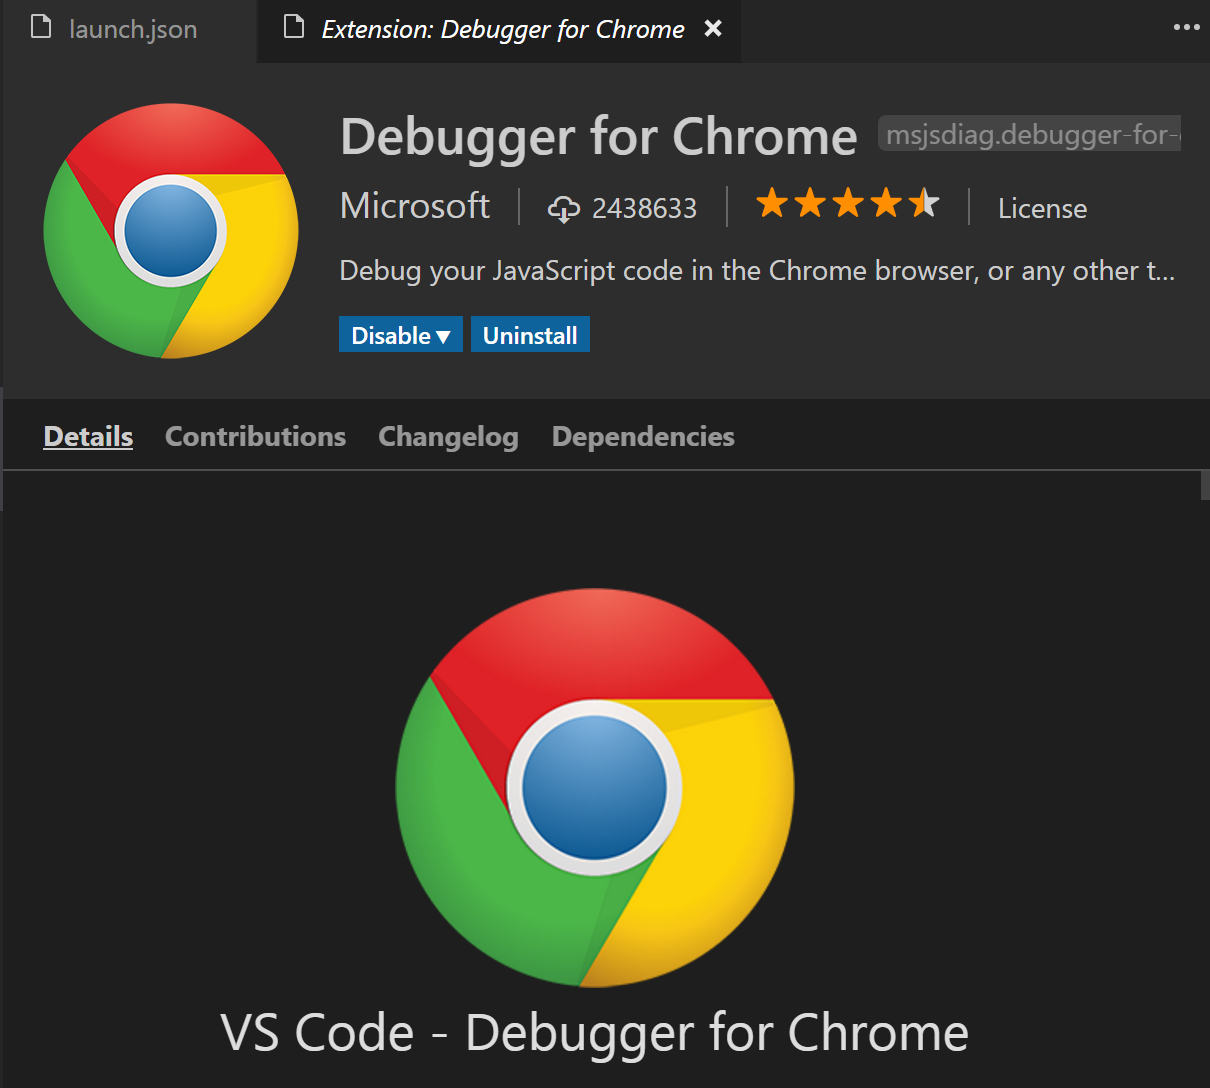
Then install 'Debugger for Chrome' extension into it.
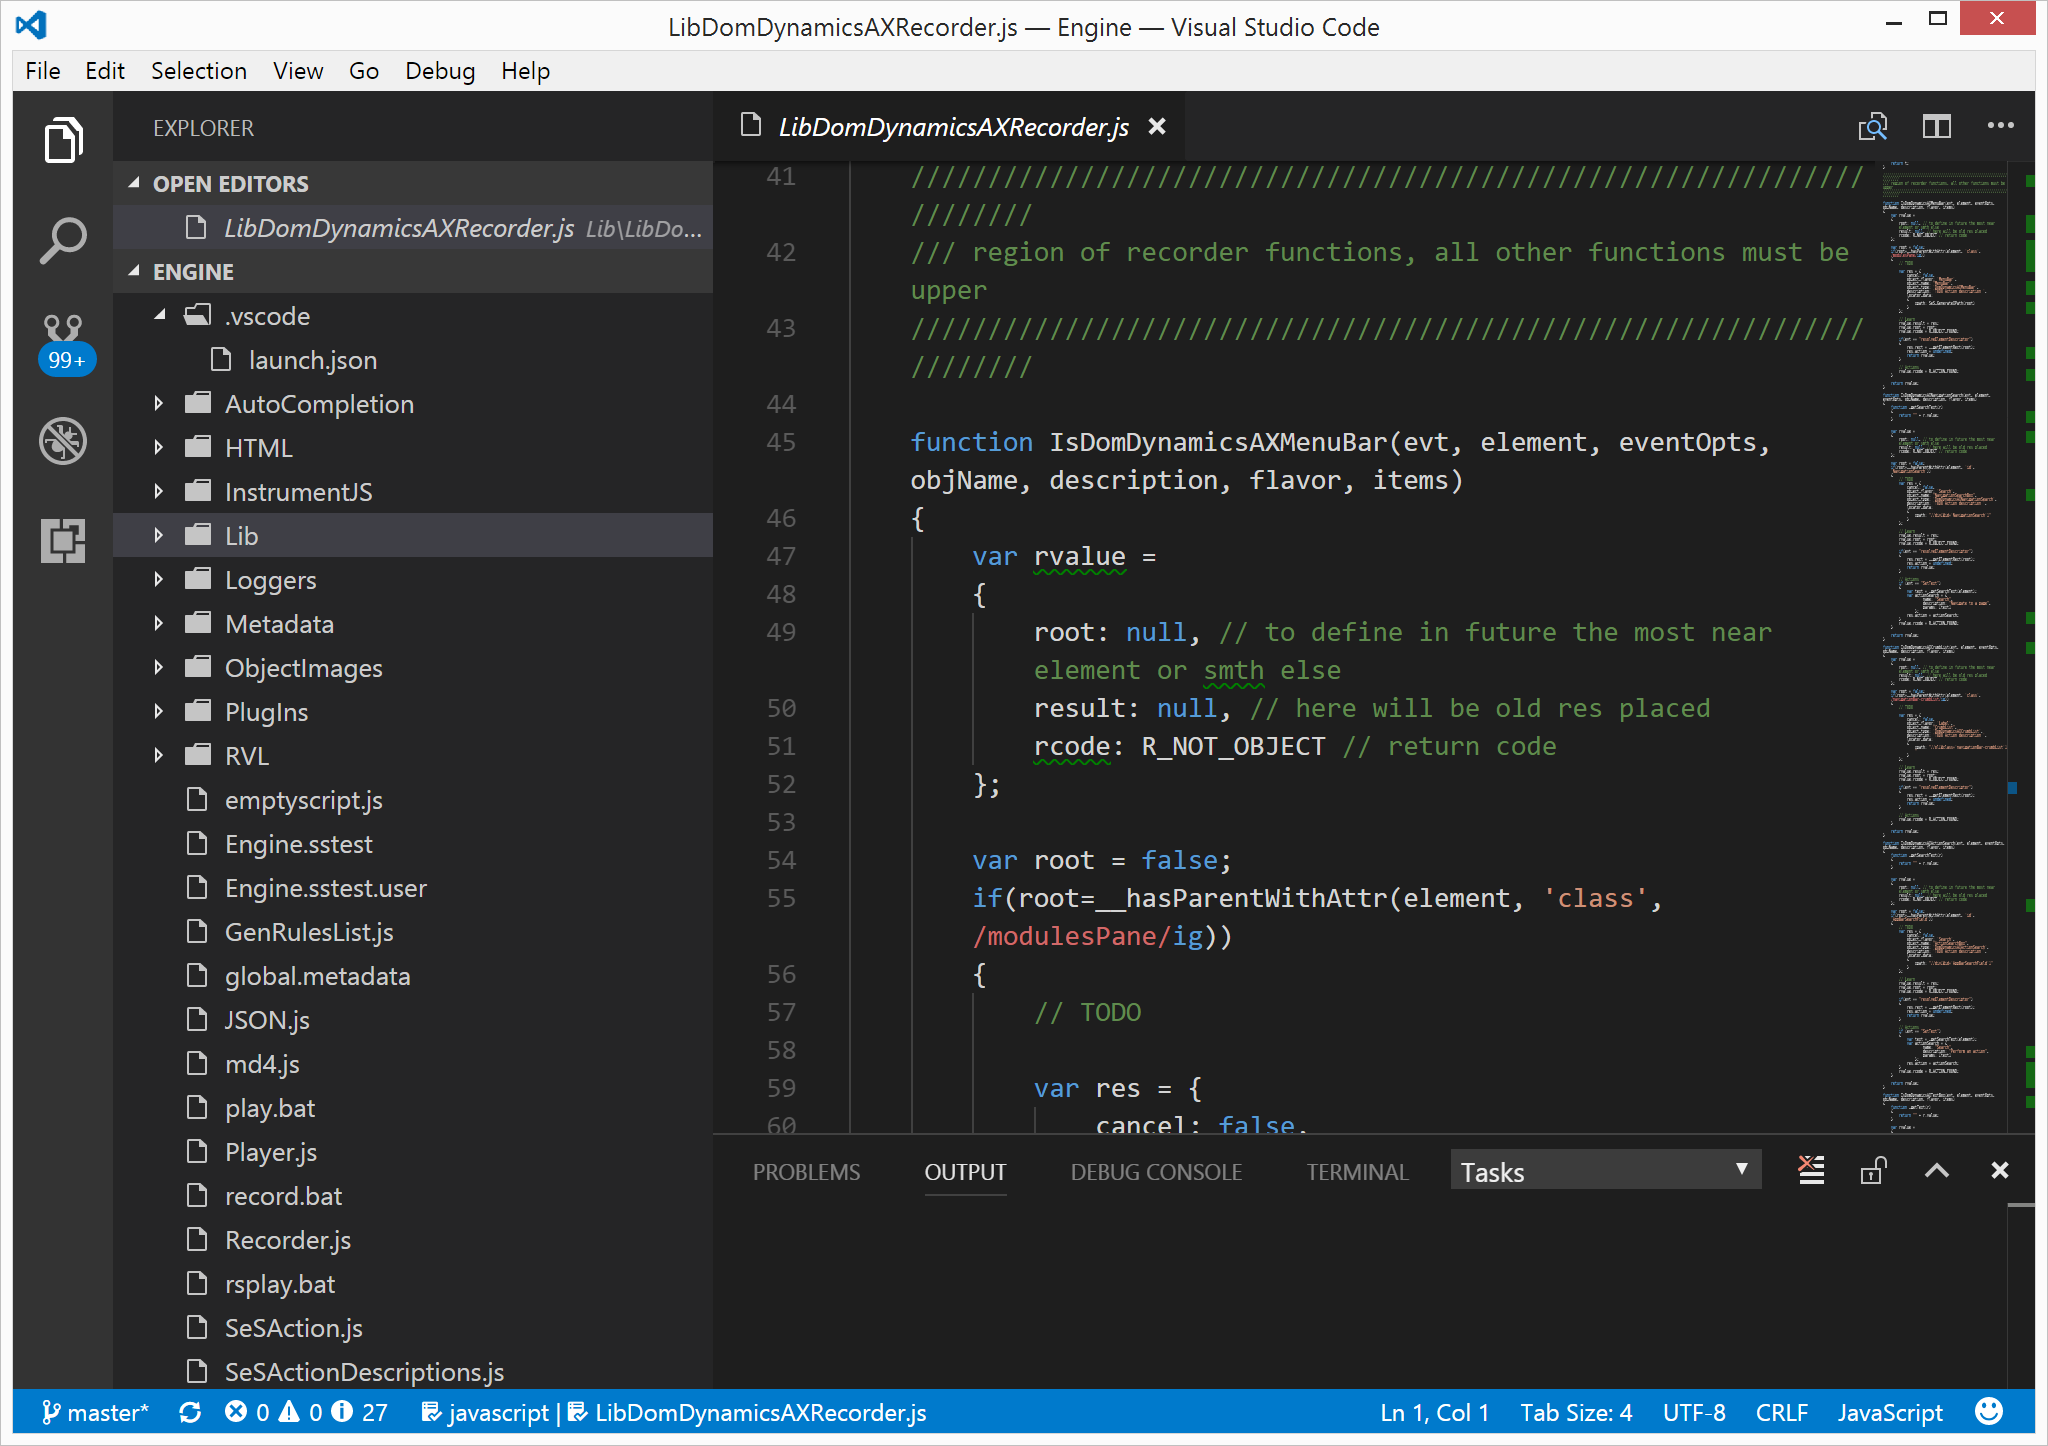
Open Rapise engine in VS Code: File > Open Folder... and choose 'C:\Program Files (x86)\Inflectra\Rapise\Core\Engine'
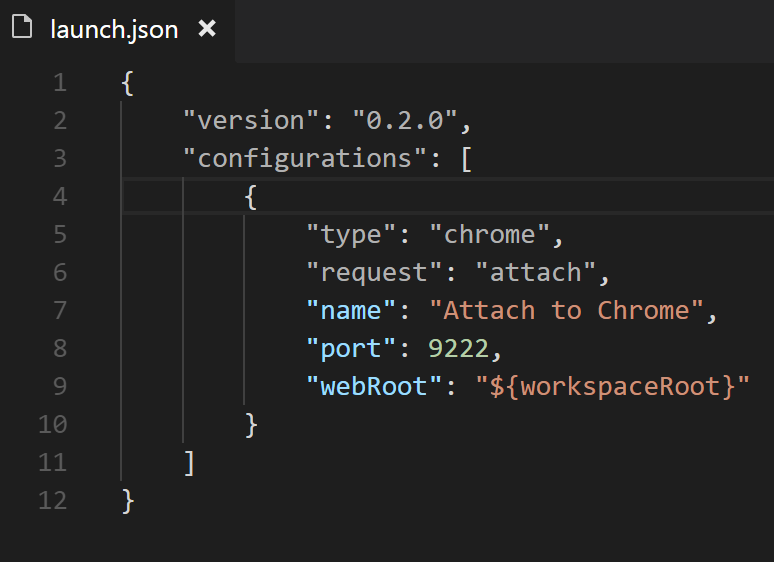
In VS Code go to Debugger pane and add new debugger configuration. Detailed info on debugger configuration is available here:
https://github.com/Microsoft/vscode-chrome-debug
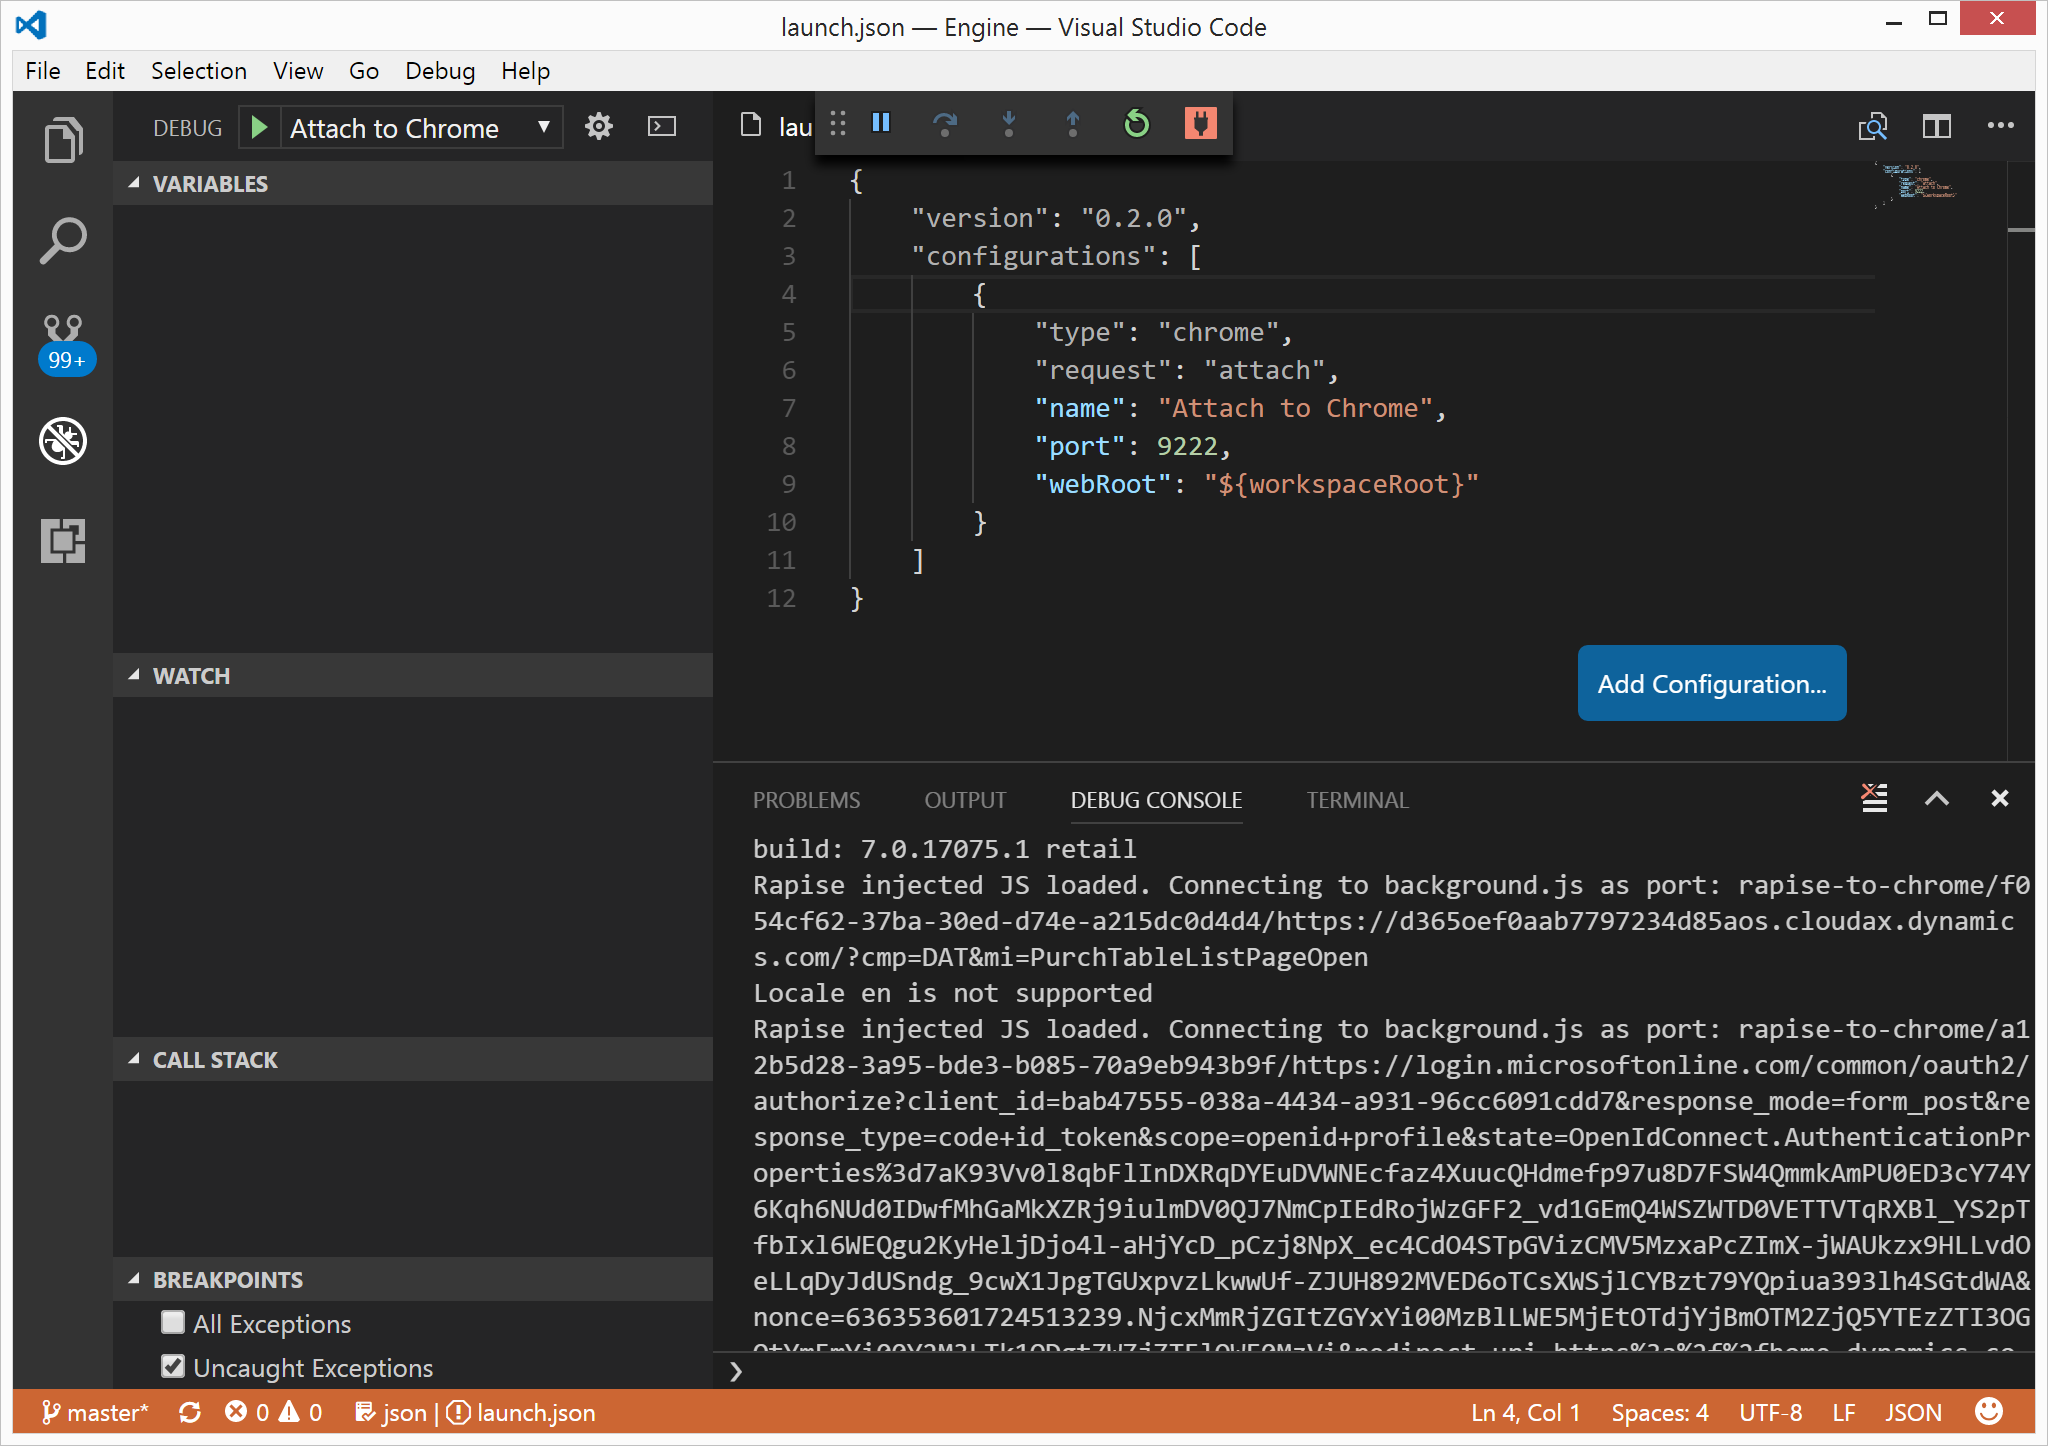
Attach VS Code to Chrome.
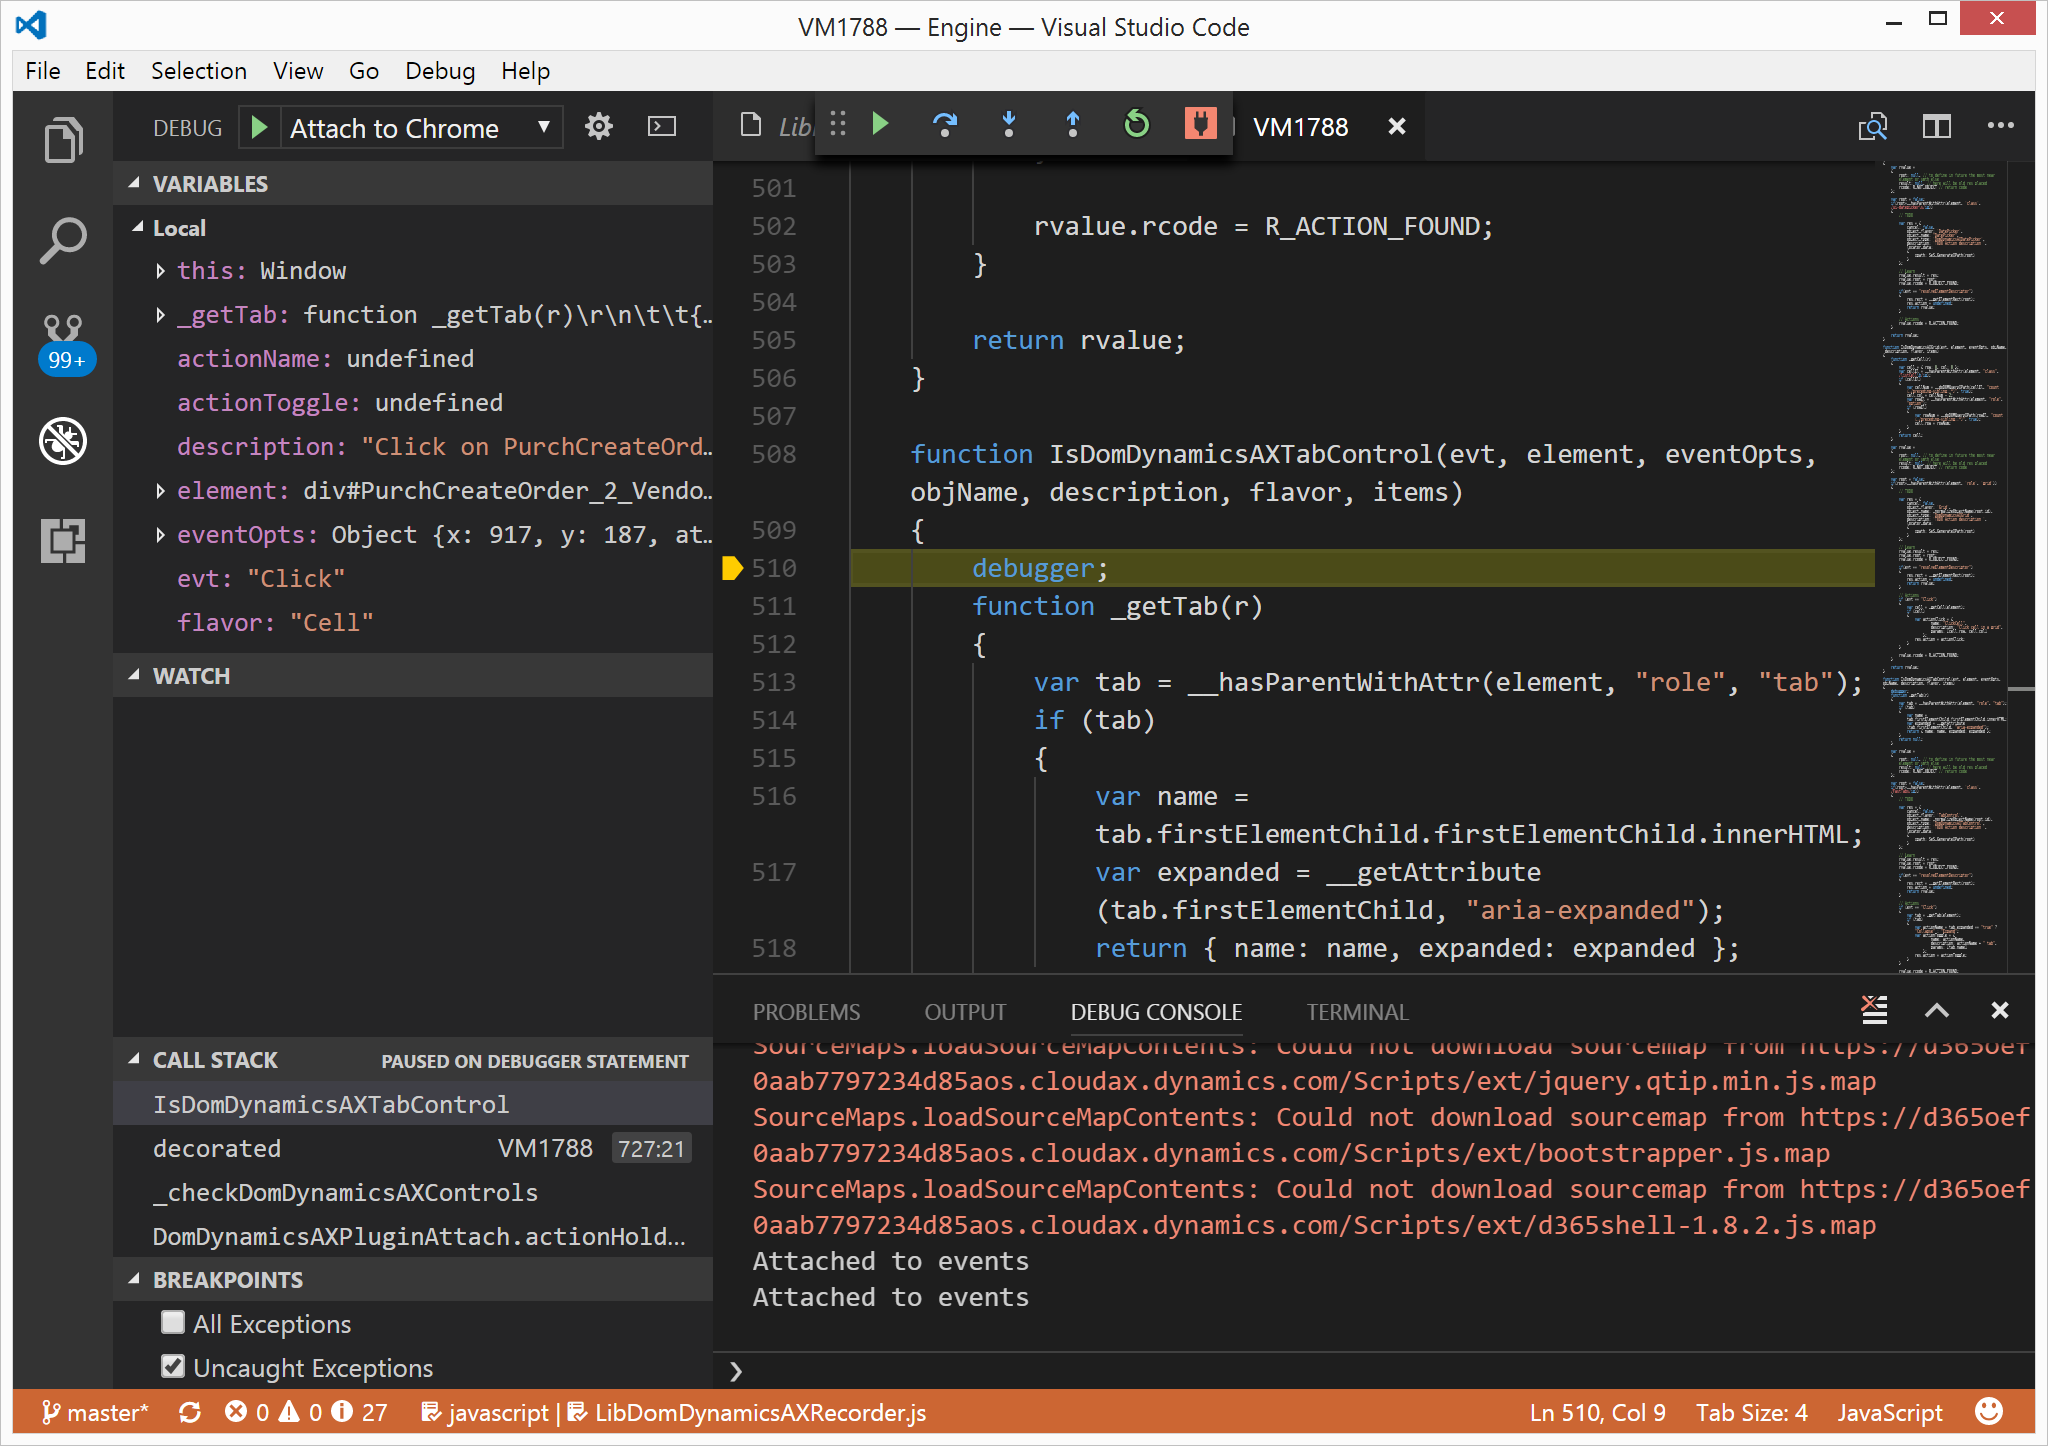
Start recording in Rapise and click on one of the tab control headers. VS Code will break into the code.
Happy debugging!