Review of Lead Time and Cycle Time
- By definition, Lead Time is the time taken for any item to be completed from the time it was identified. The cycle time is a subset of the lead time capturing the amount of time for an item to marked completed from the time the actual work started.
- So, lead time measure the process efficiency from the customer's stand point. Cycle time measures the process efficiency from the development process efficiency.
- The difference between the lead time and cycle time indicates the waiting time for that item which itself could be attributed to many reasons such as prioritization of the item relative to other items, available bandwidth for the team, risks, and other constraints.
Graphical Illustrations
The best way to illustrate lead time or cycle is to use an histogram to see the major intervals of distributed waiting time. To construct such a histogram, we need
- An approximate intervals of time taken in the X-axis. This interval period differs from business to business. In our query below, we will use an increment of 25 days and after 175 days (which is about 6 months, we put everything in one big interval).
- We count the number of items that fall within this time period and represent them in the Y-axis.
Confirming Data Set
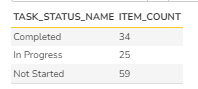
Let us confirm how many tasks are in the completed status so that our lead time and cycle time queries return the right amount of data.
Validation Query
select
  R.TASK_STATUS_NAME,
  COUNT(R.TASK_ID) as ITEM_COUNT
from
  SpiraTestEntities.R_Tasks as R
where
  R.PROJECT_ID = ${ProjectId} and
  R.IS_DELETED = False and
  R.CREATION_DATE is not null and
  R.START_DATE is not null and
  R.END_DATE is not null
group by
  R.TASK_STATUS_NAME
order by
  R.TASK_STATUS_NAME
Validation Output
According to the snapshot data shown below, we will need to have 34 items in the Cycle Time and Lead Time Histogram because 34 items are in the "Completed" State.
Graphing Lead Time
Let us create the lead time query below, explain the logic, and show the output.
Lead Time SQL Query
select C.LeadTimeTaken, sum(C.ITEMS) as ITEMS_COUNT from
(
(select R.TASK_ID, 25 as LeadTimeTaken, COUNT(R.TASK_ID) as ITEMS
from SpiraTestEntities.R_Tasks as R
 where R.PROJECT_ID = ${ProjectId} and
   R.IS_DELETED = False and
   R.CREATION_DATE is not null and
   R.END_DATE is not null and
   DiffDays(R.CREATION_DATE, R.END_DATE) >= 0  and DiffDays(R.CREATION_DATE, R.END_DATE) < 26 and
   R.TASK_STATUS_NAME = "Completed"
group by
   R.TASK_ID, R.END_DATE
order by
   R.END_DATE)
union
(select R.TASK_ID, 50 as LeadTimeTaken, COUNT(R.TASK_ID) as ITEMS
from SpiraTestEntities.R_Tasks as R
 where R.PROJECT_ID = ${ProjectId} and
   R.IS_DELETED = False and
   R.CREATION_DATE is not null and
   R.END_DATE is not null and
   DiffDays(R.CREATION_DATE, R.END_DATE) > 25 and DiffDays(R.CREATION_DATE, R.END_DATE) < 51 and
   R.TASK_STATUS_NAME = "Completed"
group by
   R.TASK_ID, R.END_DATE
order by
   R.END_DATE)
union
(select R.TASK_ID, 75  as LeadTimeTaken, COUNT(R.TASK_ID) as ITEMS
from SpiraTestEntities.R_Tasks as R
 where R.PROJECT_ID = ${ProjectId} and
   R.IS_DELETED = False and
   R.CREATION_DATE is not null and
   R.END_DATE is not null and
   DiffDays(R.CREATION_DATE, R.END_DATE) > 50 and DiffDays(R.CREATION_DATE, R.END_DATE) < 76 and
   R.TASK_STATUS_NAME = "Completed"
group by
   R.TASK_ID, R.END_DATE
order by
   R.END_DATE)
union
(select R.TASK_ID, 100 as LeadTimeTaken, COUNT(R.TASK_ID) as ITEMS
from SpiraTestEntities.R_Tasks as R
 where R.PROJECT_ID = ${ProjectId} and
   R.IS_DELETED = False and
   R.CREATION_DATE is not null and
   R.END_DATE is not null and
   DiffDays(R.CREATION_DATE, R.END_DATE) > 75 and DiffDays(R.CREATION_DATE, R.END_DATE) < 101 and
   R.TASK_STATUS_NAME = "Completed"
group by
   R.TASK_ID, R.END_DATE
order by
   R.END_DATE)
union
(select R.TASK_ID, 125 as LeadTimeTaken, COUNT(R.TASK_ID) as ITEMS
from SpiraTestEntities.R_Tasks as R
 where R.PROJECT_ID = ${ProjectId} and
   R.IS_DELETED = False and
   R.CREATION_DATE is not null and
   R.END_DATE is not null and
   DiffDays(R.CREATION_DATE, R.END_DATE) > 101 and DiffDays(R.CREATION_DATE, R.END_DATE) < 126 and
   R.TASK_STATUS_NAME = "Completed"
group by
   R.TASK_ID, R.END_DATE
order by
   R.END_DATE)
union
(select R.TASK_ID, 150 as LeadTimeTaken, COUNT(R.TASK_ID) as ITEMS
from SpiraTestEntities.R_Tasks as R
 where R.PROJECT_ID = ${ProjectId} and
   R.IS_DELETED = False and
   R.CREATION_DATE is not null and
   R.END_DATE is not null and
   DiffDays(R.CREATION_DATE, R.END_DATE) > 125 and DiffDays(R.CREATION_DATE, R.END_DATE) < 151 and
   R.TASK_STATUS_NAME = "Completed"
group by
   R.TASK_ID, R.END_DATE
order by
   R.END_DATE)
union
(select R.TASK_ID, 175 as LeadTimeTaken, COUNT(R.TASK_ID) as ITEMS
from SpiraTestEntities.R_Tasks as R
 where R.PROJECT_ID = ${ProjectId} and
   R.IS_DELETED = False and
   R.CREATION_DATE is not null and
   R.END_DATE is not null and
   DiffDays(R.CREATION_DATE, R.END_DATE) > 150 and DiffDays(R.CREATION_DATE, R.END_DATE) < 176 and
   R.TASK_STATUS_NAME = "Completed"
group by
   R.TASK_ID, R.END_DATE
order by
   R.END_DATE)
union
(select R.TASK_ID, 1000 as LeadTimeTaken, COUNT(R.TASK_ID) as ITEMS
from SpiraTestEntities.R_Tasks as R
 where R.PROJECT_ID = ${ProjectId} and
   R.IS_DELETED = False and
   R.CREATION_DATE is not null and
   R.END_DATE is not null and
   DiffDays(R.CREATION_DATE, R.END_DATE) > 175  and
   R.TASK_STATUS_NAME = "Completed"
group by
   R.TASK_ID, R.END_DATE
order by
   R.END_DATE)
) as C
group by C.LeadTimeTaken
order  by C.LeadTimeTaken
Query Explanation
- This query is constructed using multiple subqueries counting the number of items that fall within a specific time frame and aggregating them in the outer query.
- Each inner query eliminates unnecessary data where the tasks are not deleted, dates are not filled, tasks are in the completed status, and the dates between creation and end date fall within a range.
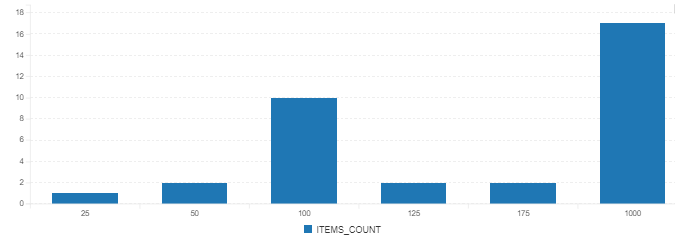
Graphical Output
The following represents the histogram from the query.
Graphing Cycle Time
Let us create the lead time query below, explain the logic, and show the output.
Cycle Time Query
The query is mainly the same as the lead time computation. But, instead of CREATION_DATE, we will use START_DATE in this query for cycle time computation.
select C.CycleTimeTaken, sum(C.ITEMS) as ITEMS_COUNT from
(
(select R.TASK_ID, 25 as CycleTimeTaken, COUNT(R.TASK_ID) as ITEMS
from SpiraTestEntities.R_Tasks as R
 where R.PROJECT_ID = ${ProjectId} and
   R.IS_DELETED = False and
   R.START_DATE is not null and
   R.END_DATE is not null and
   DiffDays(R.START_DATE, R.END_DATE) >= 0 and DiffDays(R.START_DATE, R.END_DATE) < 26 and
   R.TASK_STATUS_NAME = "Completed"
group by
   R.TASK_ID, R.END_DATE
order by
   R.END_DATE)
union
(select R.TASK_ID, 50 as CycleTimeTaken, COUNT(R.TASK_ID) as ITEMS
from SpiraTestEntities.R_Tasks as R
 where R.PROJECT_ID = ${ProjectId} and
   R.IS_DELETED = False and
   R.START_DATE is not null and
   R.END_DATE is not null and
   DiffDays(R.START_DATE, R.END_DATE) > 25 and DiffDays(R.START_DATE, R.END_DATE) < 51 and
   R.TASK_STATUS_NAME = "Completed"
group by
   R.TASK_ID, R.END_DATE
order by
   R.END_DATE)
union
(select R.TASK_ID, 75  as CycleTimeTaken, COUNT(R.TASK_ID) as ITEMS
from SpiraTestEntities.R_Tasks as R
 where R.PROJECT_ID = ${ProjectId} and
   R.IS_DELETED = False and
   R.START_DATE is not null and
   R.END_DATE is not null and
   DiffDays(R.START_DATE, R.END_DATE) > 50 and DiffDays(R.START_DATE, R.END_DATE) < 76 and
   R.TASK_STATUS_NAME = "Completed"
group by
   R.TASK_ID, R.END_DATE
order by
   R.END_DATE)
union
(select R.TASK_ID, 100 as CycleTimeTaken, COUNT(R.TASK_ID) as ITEMS
from SpiraTestEntities.R_Tasks as R
 where R.PROJECT_ID = ${ProjectId} and
   R.IS_DELETED = False and
   R.START_DATE is not null and
   R.END_DATE is not null and
   DiffDays(R.START_DATE, R.END_DATE) > 75 and DiffDays(R.START_DATE, R.END_DATE) < 101 and
   R.TASK_STATUS_NAME = "Completed"
group by
   R.TASK_ID, R.END_DATE
order by
   R.END_DATE)
union
(select R.TASK_ID, 125 as CycleTimeTaken, COUNT(R.TASK_ID) as ITEMS
from SpiraTestEntities.R_Tasks as R
 where R.PROJECT_ID = ${ProjectId} and
   R.IS_DELETED = False and
   R.START_DATE is not null and
   R.END_DATE is not null and
   DiffDays(R.START_DATE, R.END_DATE) > 101 and DiffDays(R.START_DATE, R.END_DATE) < 126 and
   R.TASK_STATUS_NAME = "Completed"
group by
   R.TASK_ID, R.END_DATE
order by
   R.END_DATE)
union
(select R.TASK_ID, 150 as CycleTimeTaken, COUNT(R.TASK_ID) as ITEMS
from SpiraTestEntities.R_Tasks as R
 where R.PROJECT_ID = ${ProjectId} and
   R.IS_DELETED = False and
   R.START_DATE is not null and
   R.END_DATE is not null and
   DiffDays(R.START_DATE, R.END_DATE) > 125 and DiffDays(R.START_DATE, R.END_DATE) < 151 and
   R.TASK_STATUS_NAME = "Completed"
group by
   R.TASK_ID, R.END_DATE
order by
   R.END_DATE)
union
(select R.TASK_ID, 175 as CycleTimeTaken, COUNT(R.TASK_ID) as ITEMS
from SpiraTestEntities.R_Tasks as R
 where R.PROJECT_ID = ${ProjectId} and
   R.IS_DELETED = False and
   R.START_DATE is not null and
   R.END_DATE is not null and
   DiffDays(R.START_DATE, R.END_DATE) > 150 and DiffDays(R.START_DATE, R.END_DATE) < 176 and
   R.TASK_STATUS_NAME = "Completed"
group by
   R.TASK_ID, R.END_DATE
order by
   R.END_DATE)
union
(select R.TASK_ID, 1000 as CycleTimeTaken, COUNT(R.TASK_ID) as ITEMS
from SpiraTestEntities.R_Tasks as R
 where R.PROJECT_ID = ${ProjectId} and
   R.IS_DELETED = False and
   R.START_DATE is not null and
   R.END_DATE is not null and
   DiffDays(R.START_DATE, R.END_DATE) > 175 and
   R.TASK_STATUS_NAME = "Completed"
group by
   R.TASK_ID, R.END_DATE
order by
   R.END_DATE)
) as C
group by C.CycleTimeTaken
order  by C.CycleTimeTaken
Query Explanation
Please refer to the earlier query explanation as the logic is similar.
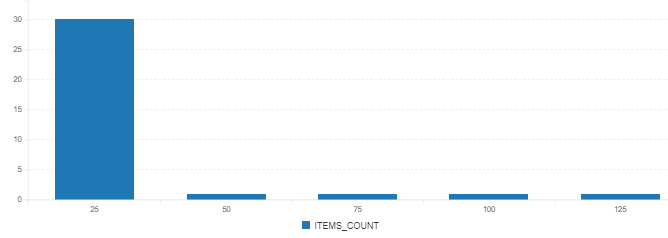
Cycle Time Histogram
Given below is the cycle time histogram.
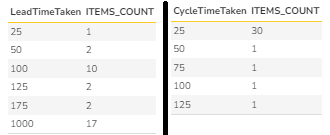
Confirming Item Counts
Given below is the results of the two earlier graphs in a tabular form confirming 34 items in both the lead time and cycle time histograms.
Interpreting the Histograms
Since Lead time determines the overall process efficiency, we can see that only 1 or 2 tasks are picked up within a 25-day or 50-day range respectively. A majority of them took 100 days. About 4 tasks more than 100 days. 50% of tasks took more than 175 days. This is an indication of many things such as ambiguous tasks, unavailability of resources, or inadequate prioritization. It does not always indicate the team's ability to develop and deliver. A good next step is to engage in subsequent root-cause analysis followed by using Ishikawa diagram, force field analysis, and pareto analysis.
Once work began on any item, the development efficiency seems very high as 30/34 items were delivered within 25 days. This is an indication of high team maturity (self-organization, for instance), good process efficiency, and detailed task breakdown. Since the percentage of tasks taking more is very small and spreads over multiple days, these tasks can be taken into additional consideration depending upon the severity of those tasks impacting project goals and engage in root cause analysis.